Introduction to experimental design
Session 1
MATH 80667A: Experimental Design and Statistical Methods
HEC Montréal
Outline
Outline
Class details
Outline
Class details
Motivation
Outline
Class details
Motivation
Review
Outline
Class details
Motivation
Review
Key concepts in experimental designs
Class details
Course content
Content
- Basics of experimental design
- Statistical inference
- Completely randomized designs
- Analysis of variance
- Blocked designs
- Analysis of covariance
- Intro to mixed models
- Intro to causal inference
- Linear mediation analysis
We will focus on simple designs as they lead to simple analysis. For more complicated schemes, consult an expert or find a collaborator.
A single introductory course in statistics does not make one an expert. The purpose is more numerical literacy then expert knowledge.
However, the assessment, activities and interdisciplinary skills are targeted for PhD students
We will spend a lot of time on ANOVA (one-way, two-way, multivariate, repeated measures, etc.)
Course content
Content
- Basics of experimental design
- Statistical inference
- Completely randomized designs
- Analysis of variance
- Blocked designs
- Analysis of covariance
- Intro to mixed models
- Intro to causal inference
- Linear mediation analysis
Cross-disciplinary skills
- Scientific workflow
- Peer-review
- Reporting
- Statistical fallacies
- Reproducibility
We will focus on simple designs as they lead to simple analysis. For more complicated schemes, consult an expert or find a collaborator.
A single introductory course in statistics does not make one an expert. The purpose is more numerical literacy then expert knowledge.
However, the assessment, activities and interdisciplinary skills are targeted for PhD students
We will spend a lot of time on ANOVA (one-way, two-way, multivariate, repeated measures, etc.)
The reproducibility crisis has changed the publishing landscape, so the requirements for publications are more stringent. I intend to cover these in details.
Statistical fallacies are common mistakes that discredit the validity of your work. Learning to recognize them in the wild is crucial (also as reviewer).
Prerequisites
Prerequisites
Math skills
Basic algebra
Prerequisites
Math skills
Basic algebra
Computer science
None
Prerequisites
Math skills
Basic algebra
Computer science
None
Statistics
At the level of OpenIntro Statistics (Chapter 1)
More specifically for statistics:
- variable types (continuous, discrete, etc.)
- basic graphs (histograms, scatterplots)
- hypothesis testing
- differences in mean (e.g., t-test)
- simple linear regression
The OpenIntro Statistics book can be freely downloaded from https://www.openintro.org/book/os/
Motivation
History
Experiments on agricultural trials in Rothamsted ongoing since 1843


https://www.rothamsted.ac.uk/environmental-change-network
http://www.era.rothamsted.ac.uk/images/metadata/rbk1/2012-AJ-12-10.jpg
R.A. Fisher worked 14 years at Rothamsted from 1919 and developed much of the theory underlying experimental design See this recollection by Yates on his contribution: https://doi.org/10.2307/2528399
Fisher was a eugenist and his views are largely decried nowadays.
Modern experiments: A/B testing

This illustrates changes to the design (Follow now high-contrast in black). This is an example of A/B testing common in web design.
Evidence-based policy
RAND health insurance study
Student Teacher Achievement Ratio (STAR)
RAND: In a large-scale, multiyear experiment, participants who paid for a share of their health care used fewer health services than a comparison group given free care. It concluded that cost sharing reduced "inappropriate or unnecessary" medical care (overutilization), but also reduced "appropriate or needed" medical care. https://www.rand.org/health-care/projects/hie.html
Tennessee's STAR project: smaller class sizes lead to better outcomes "Over 7,000 students in 79 schools were randomly assigned into one of 3 interventions: small class (13 to 17 students per teacher), regular class (22 to 25 students per teacher), and regular-with-aide class (22 to 25 students with a full-time teacher's aide). Classroom teachers were also randomly assigned to the classes they would teach. The interventions were initiated as the students entered school in kindergarten and continued through third grade." https://dss.princeton.edu/catalog/resource1589
Nobel memorial prize

Review
Population and sampling
Defining a target population
Sampling frame
Where to draw sample from
Sampling procedure
Randomness
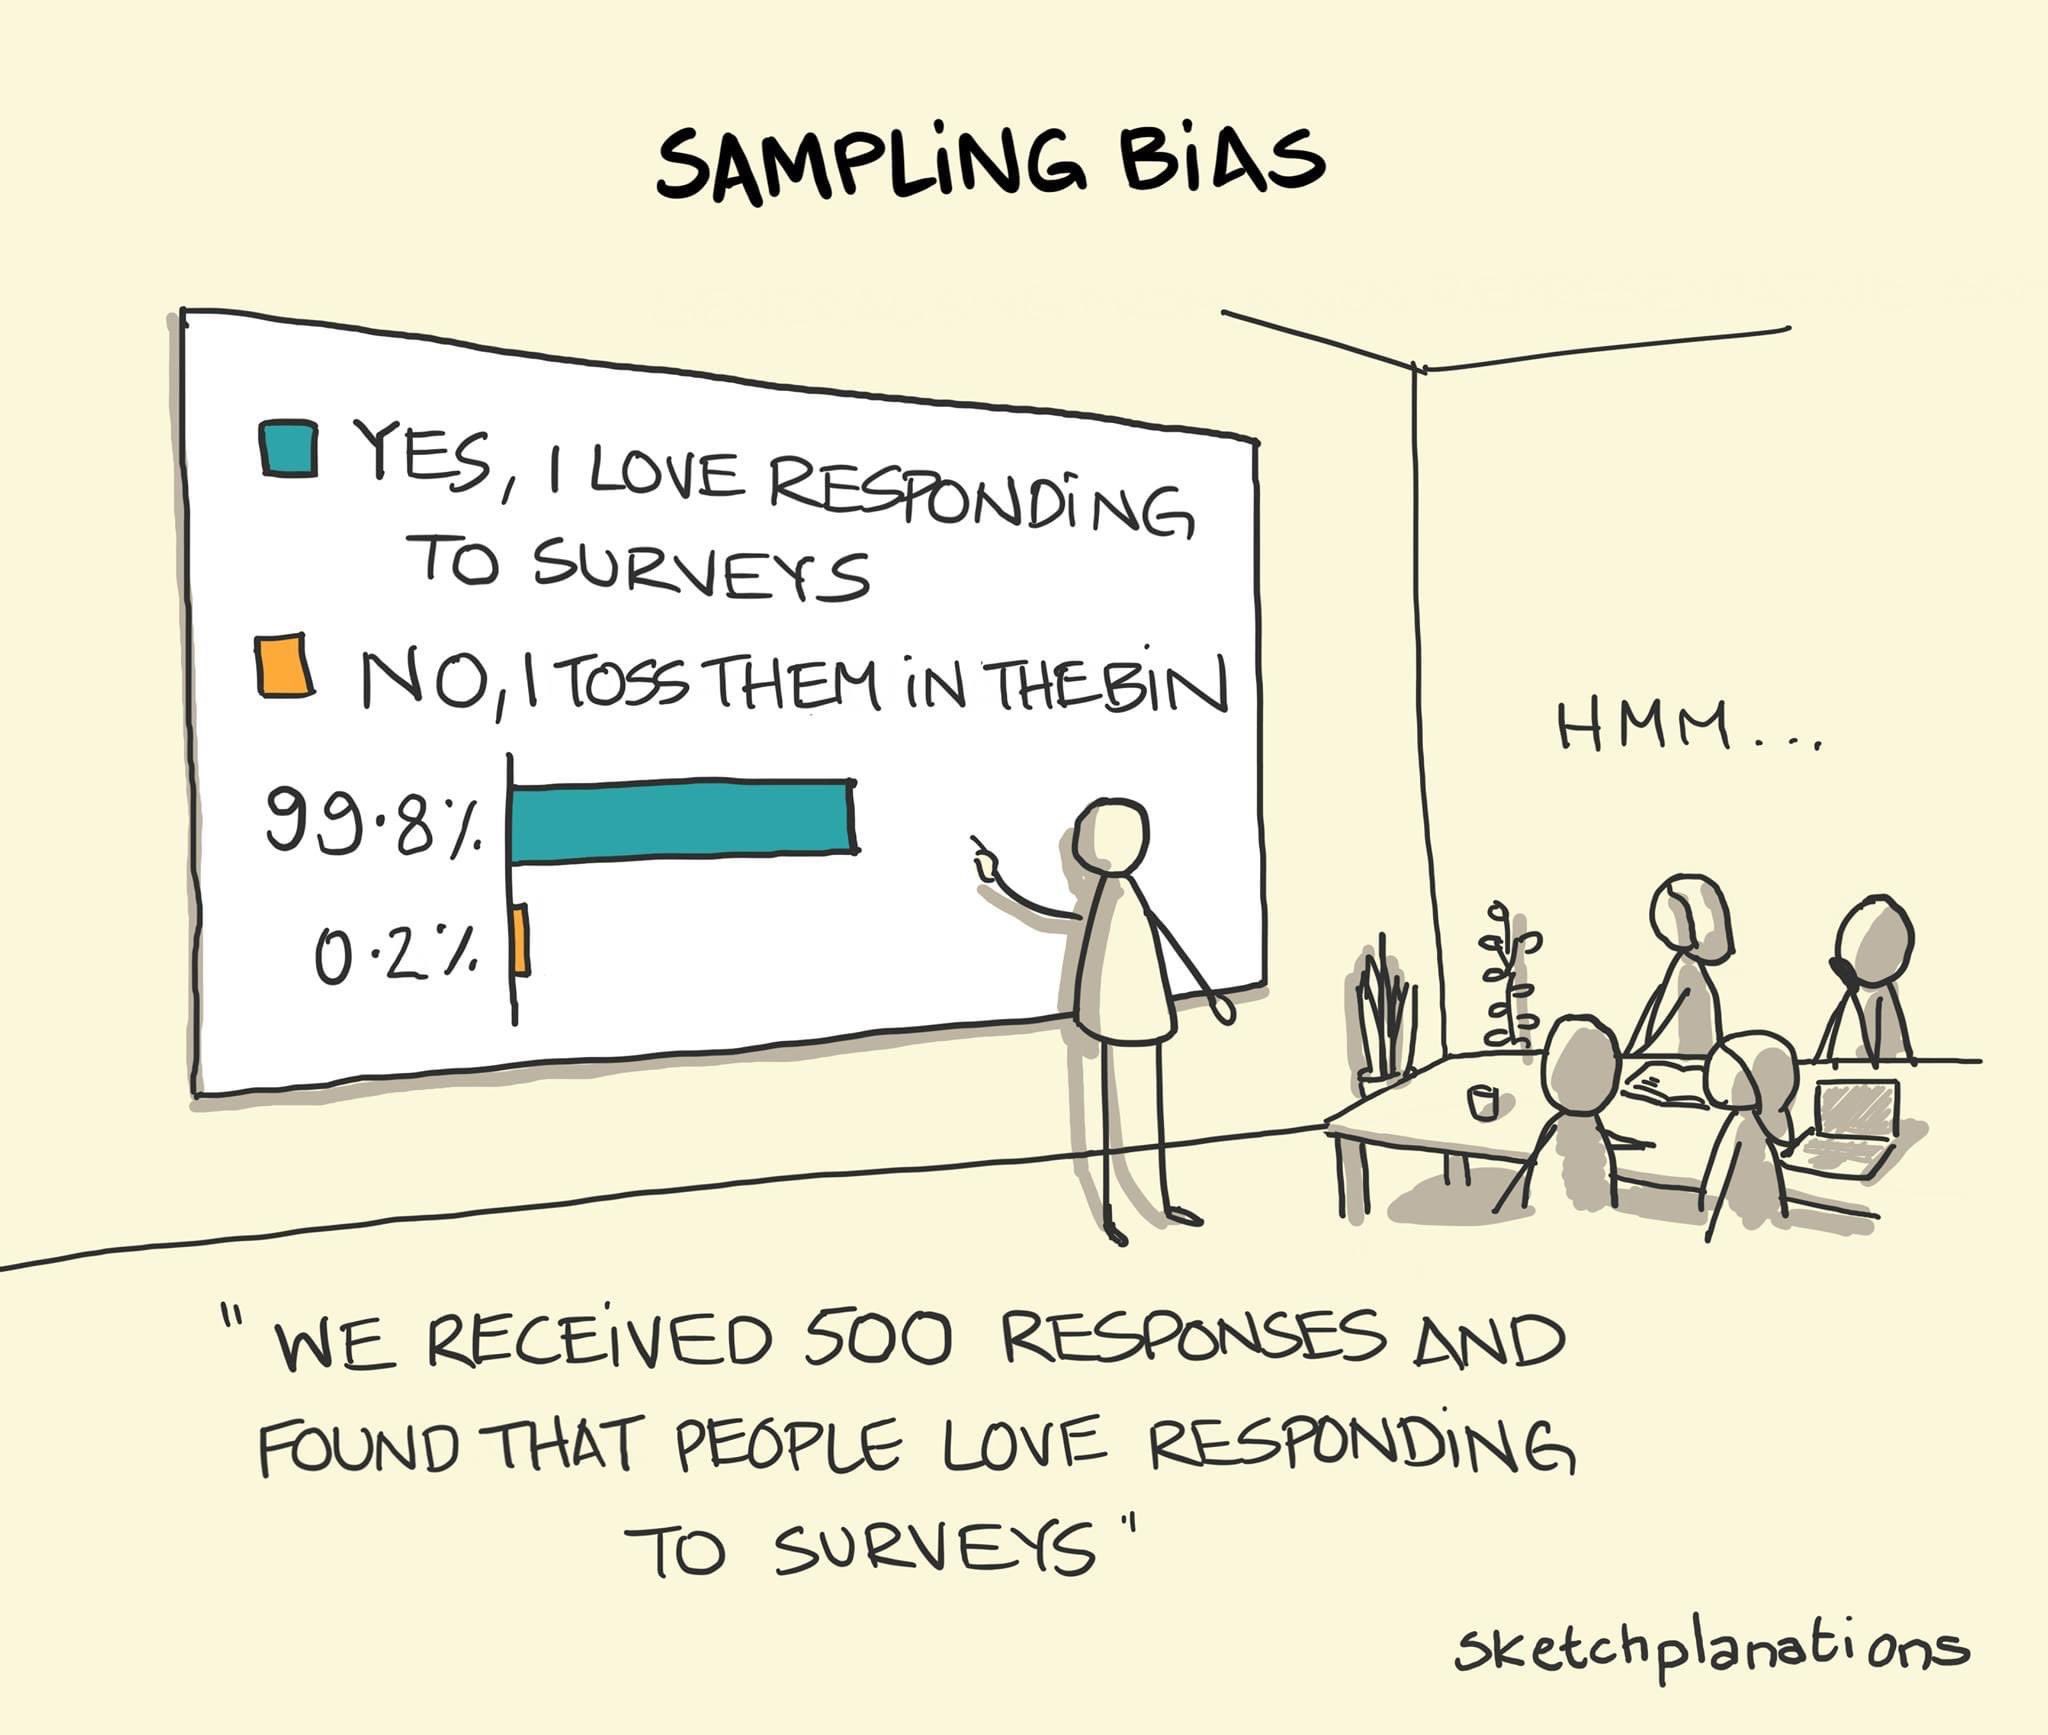
Convenience samples and non-response bias
Sampling scheme
Simple random sampling
Stratified sampling
Cluster sampling
Multi-stage sampling
Stratified sampling: select the same fraction (gender, ethnicity, etc.) Useful for oversampling rare categories Clustering sampling: villages, housing blocks, classrooms. Lower quality than stratified sampling, but cheaper
Combination of different sampling
Judging the quality of a sample
Summary statistics
Raw data
Pre-testing
Summary statistics: Reported to check representativeness of the sample relative to population.
Raw data: Used for reproducibility and to assess whether data is fraudulent.
Pre-testing: Check whether sampling allocation is sufficiently random.
U. Simonsohn, L. Nelson and J. Simmons. Evidence of Fraud in an Influential Field Experiment About Dishonesty, 2021, https://datacolada.org/98.
Experiments as gold-standard

Randomised controlled trials (RCTs) are the reference standard for studying causal relationships between interventions and outcomes as randomisation eliminates much of the bias inherent with other study designs.
Paper available at https://doi.org/10.1111/1471-0528.15199
From the abstract: "Randomised controlled trials (RCTs) are the reference standard for studying causal relationships between interventions and outcomes as randomisation eliminates much of the bias inherent with other study designs."
Study type versus sampling
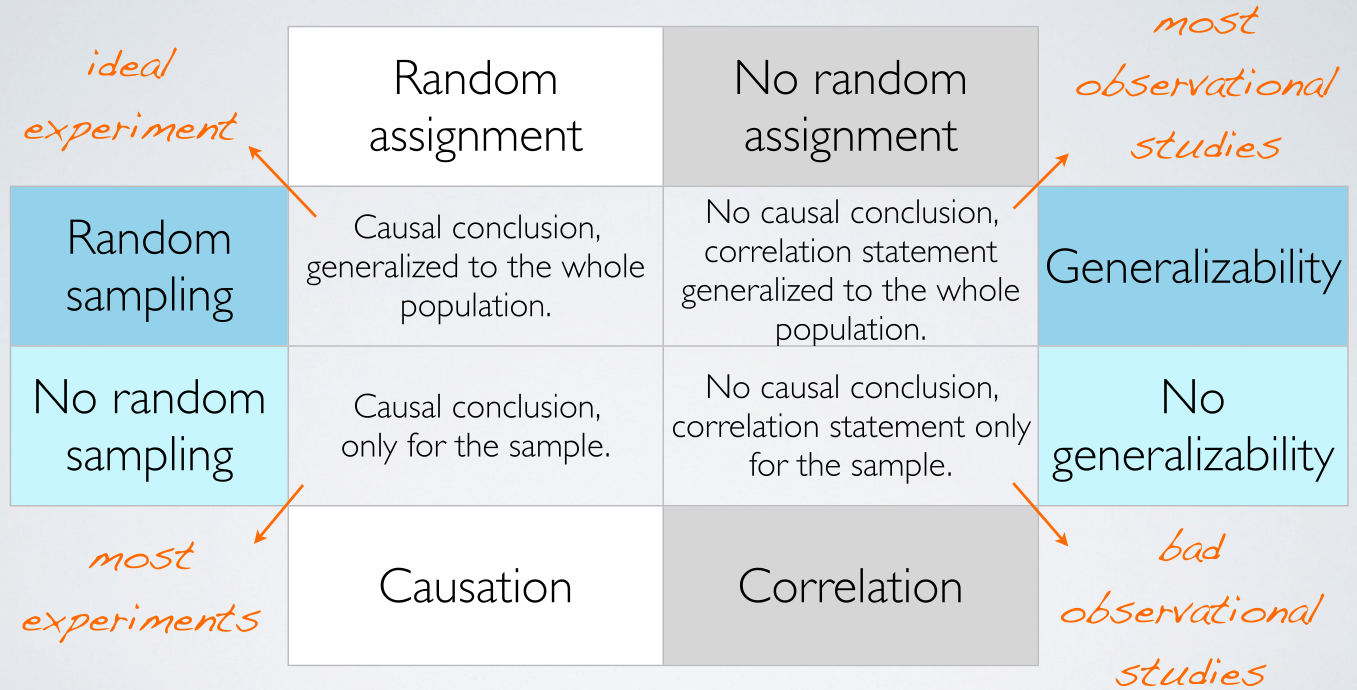
Experimental versus observational
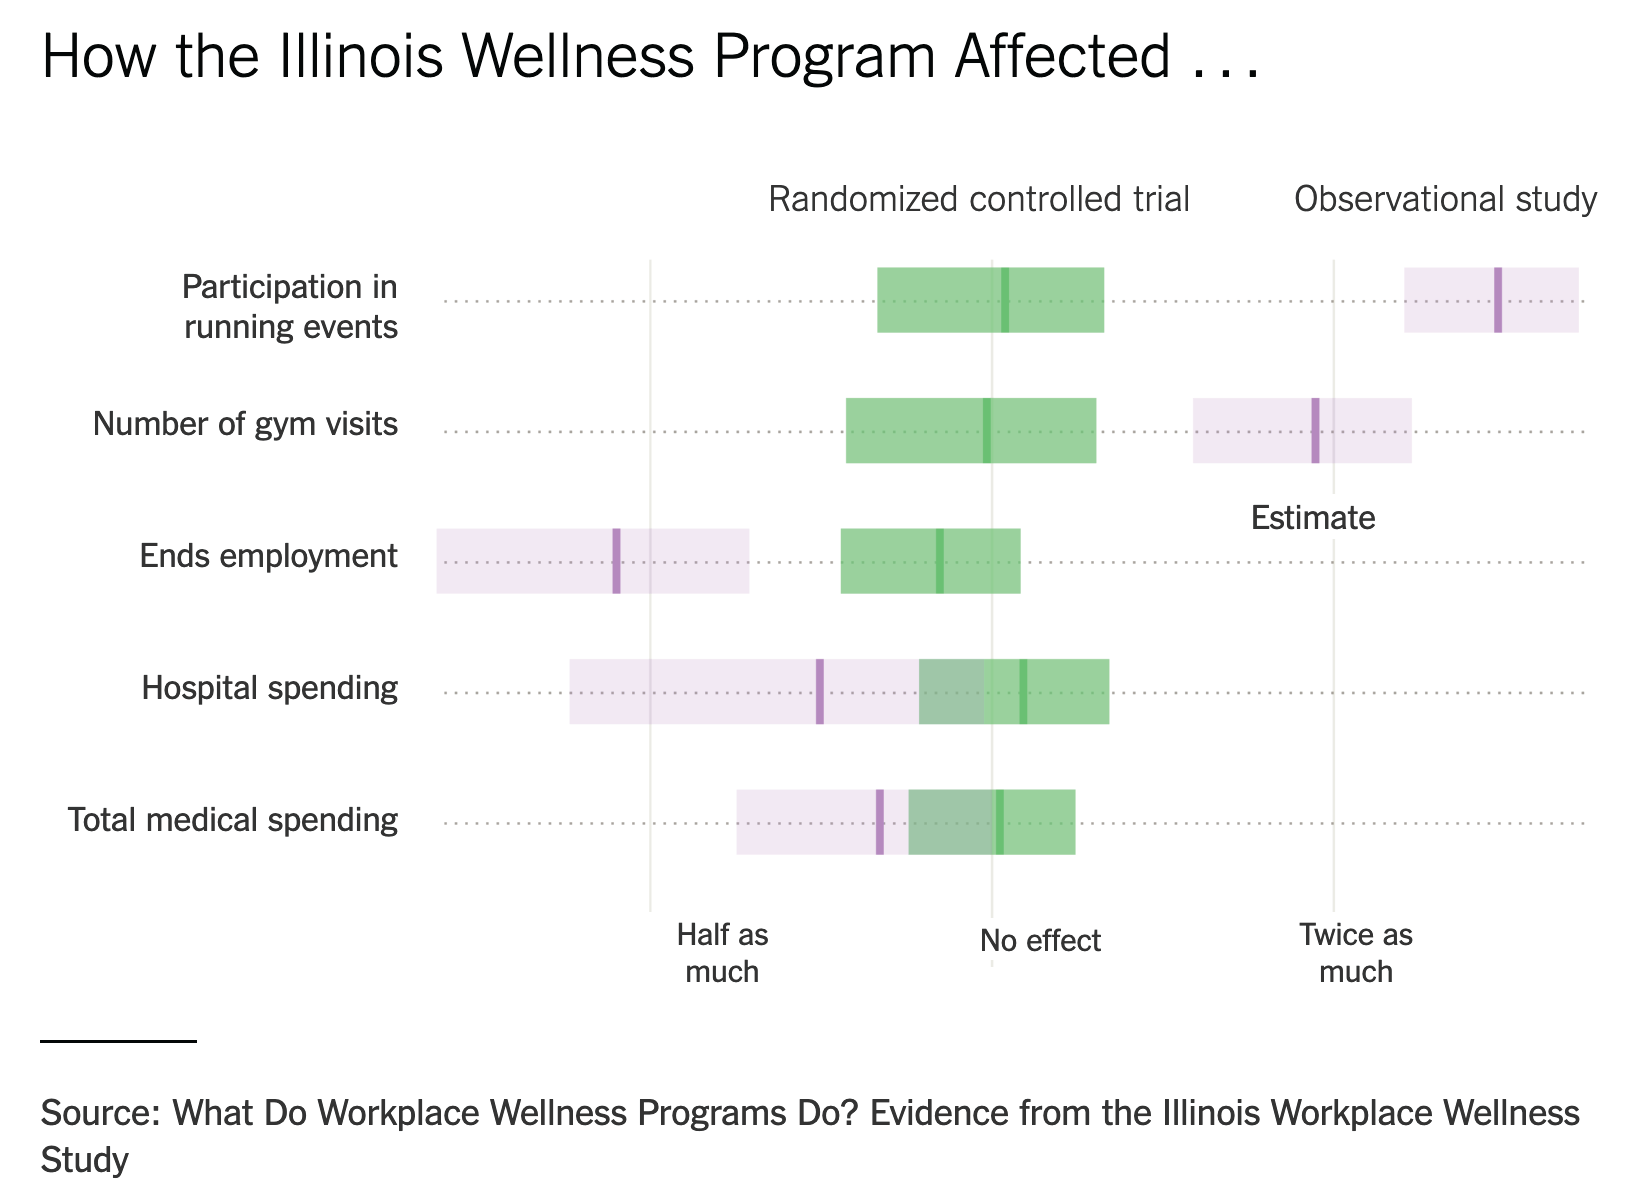
Figure from the Upshot https://www.nytimes.com/2018/08/06/upshot/employer-wellness-programs-randomized-trials.html
based on the paper
Damon Jones, David Molitor, Julian Reif, What do Workplace Wellness Programs do? Evidence from the Illinois Workplace Wellness Study, The Quarterly Journal of Economics, Volume 134, Issue 4, November 2019, Pages 1747–1791, https://doi.org/10.1093/qje/qjz023
Key concepts in experimental design
Technical vocabulary
Experimental unit
Measurement unit
Factor
Impact of encouragement on teaching
From Davison (2008), Example 9.2
In an investigation on the teaching of arithmetic, 45 pupils were divided at random into five groups of nine. Groups A and B were taught in separate classes by the usual method. Groups C, D, and E were taught together for a number of days. On each day C were praised publicly for their work, D were publicly reproved and E were ignored. At the end of the period all pupils took a standard test.
Exercise
In pairs, identify
- the experimental and measurement units
- the factor levels
- the response variable
03:00
Comparing groups (factor levels)
- Without any intervention, variability in output from one observation to the next.
- Differences between groups are comparatively stable.
Choices in experimental designs
- factor levels being compared
- observations to be made (number of repetitions, etc.)
- experimental units
Requirements for good experiments
- Absence of systematic error
- Precision
- Range of validity
- Simplicity of the design
Absence of systematic error
- Achieved via randomization
- Controlling the environment
If we allocate observations non-randomly (for example timing of a course vs instructor), we cannot necessarily distinguish between effects
Controlled environment: reduce as much variability (room temperature, experimental apparatus, instructions, etc.)
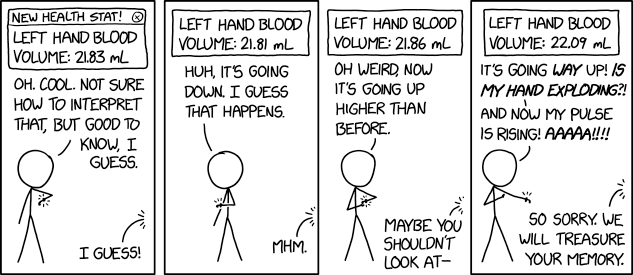
Precision
Precision
- depends on the intrinsic variability
- function of
- accuracy of experimental work
- number of experimental units / repetitions per unit
- design and methods of analysis
Range of validity
- What is population?
- Identify restrictions
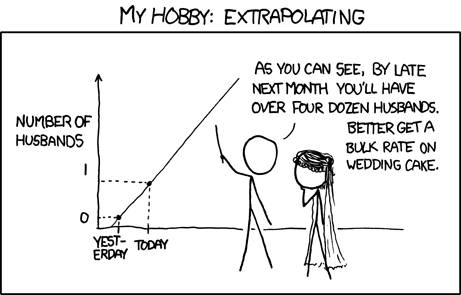
- Extrapolation
- if proper random sampling scheme
- range of validity
Simplicity of the design
- Simple designs lead to simple statistical analyses
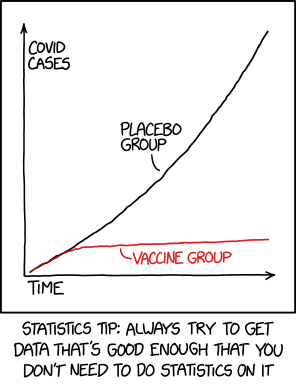
Important: understand reasons for difference
- do not limit to experimental knowledge about the differences