Hypothesis testing
Session 2
MATH 80667A: Experimental Design and Statistical Methods
HEC Montréal
Outline
Outline
Variability
Outline
Variability
Hypothesis tests
Outline
Variability
Hypothesis tests
Pairwise comparisons
Sampling variability
Studying a population
Interested in impacts of intervention or policy

Population distribution (describing possible outcomes and their frequencies) encodes everything we could be interested in.
Sampling variability
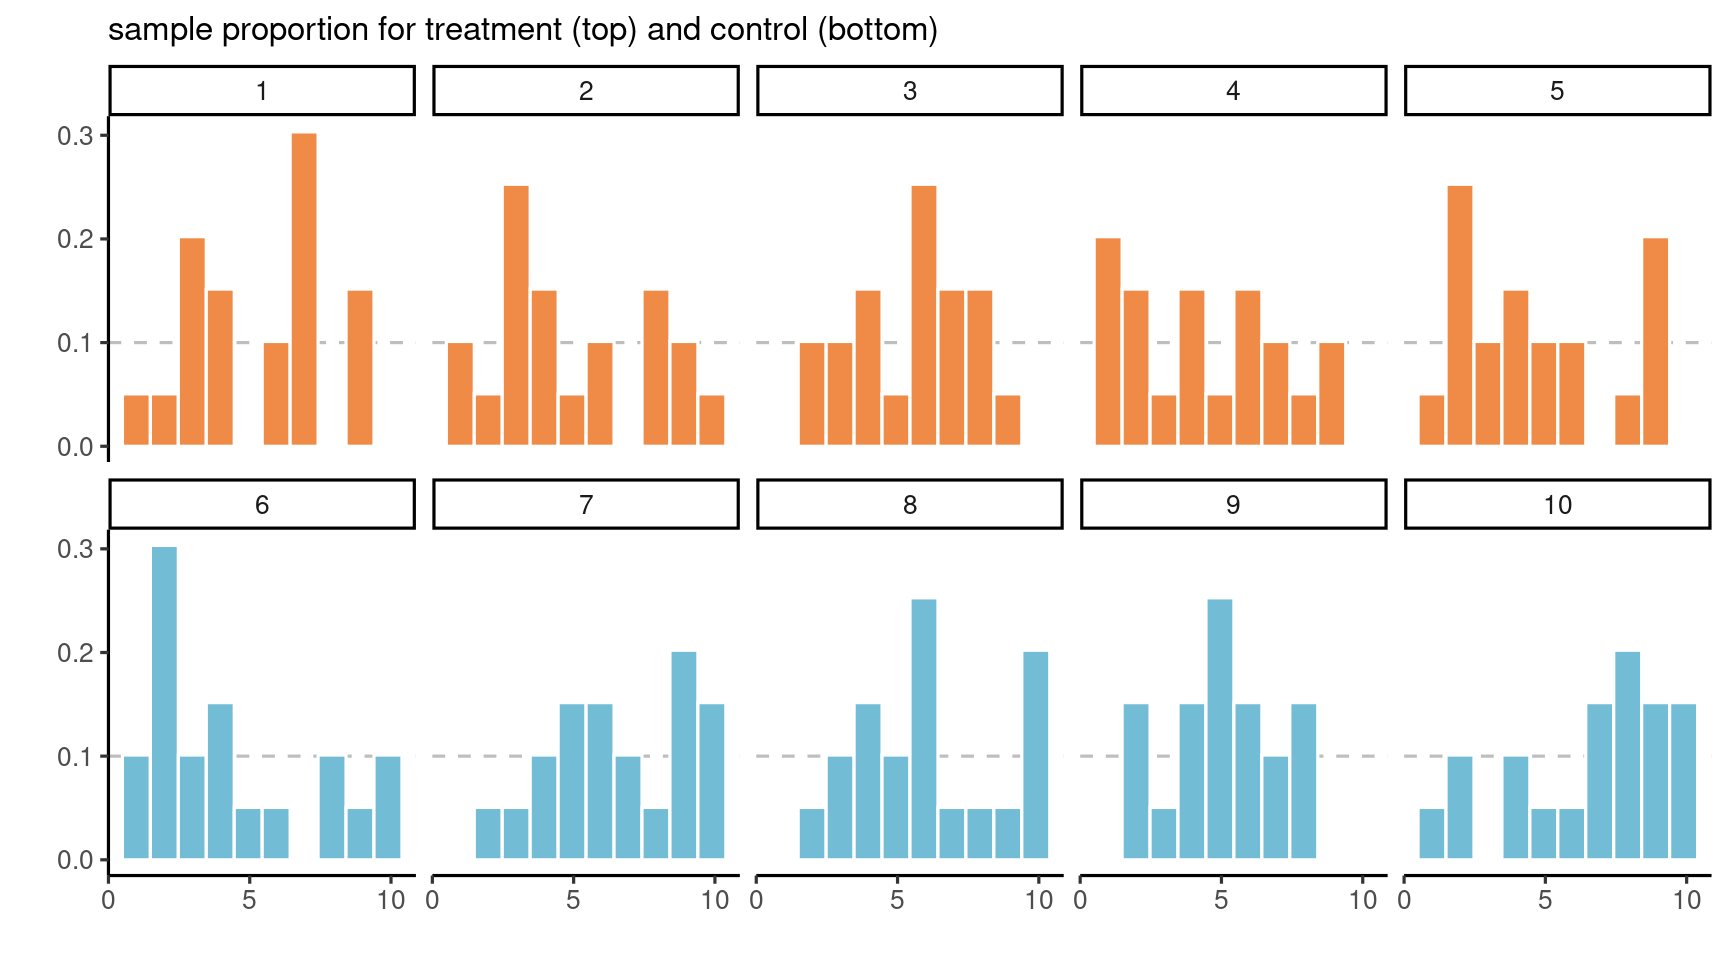
Histograms for 10 random samples of size 20 from a discrete uniform distribution.
Decision making under uncertainty
Data collection costly
→ limited information available about population.
Sample too small to reliably estimate distribution
Focus instead on particular summaries
→ mean, variance, odds, etc.
Population characteristics
mean / expectation
μ
standard deviation
σ=√variance
same scale as observations

Do not confuse standard error (variability of statistic) and standard deviation (variability of observation from population)
Sampling variability
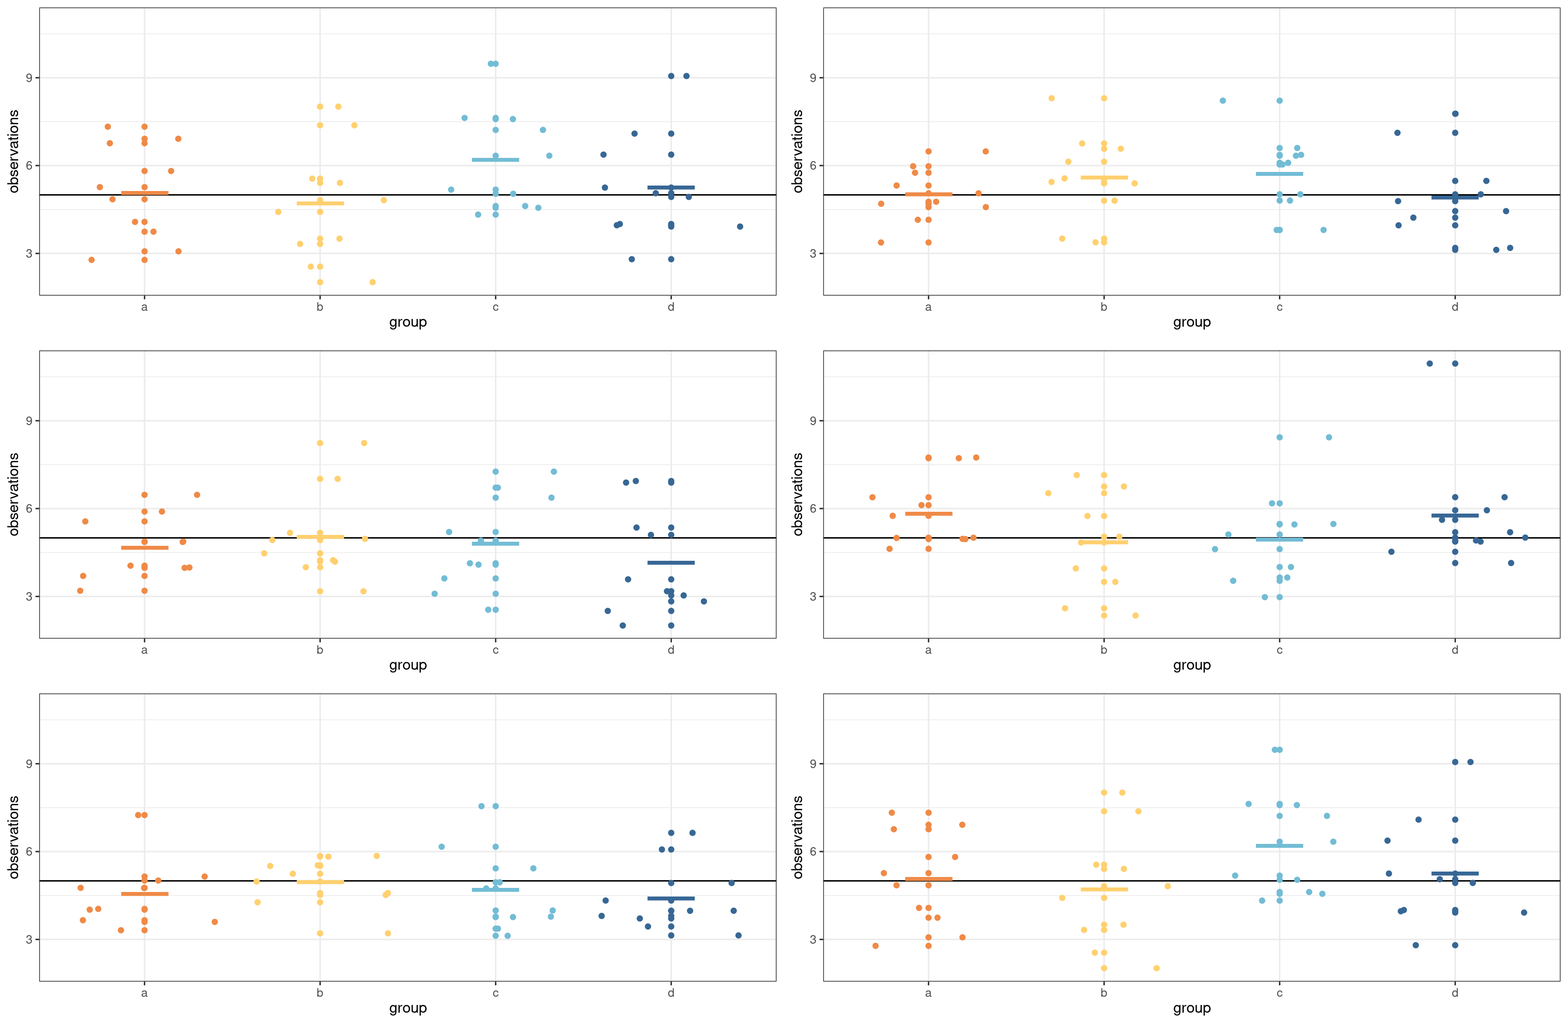
Not all samples are born alike
- Analogy: comparing kids (or siblings): not everyone look alike (except twins...)
- Chance and haphazard variability mean that we might have a good idea, but not exactly know the truth.
The signal and the noise

Can you spot the differences?
Information accumulates
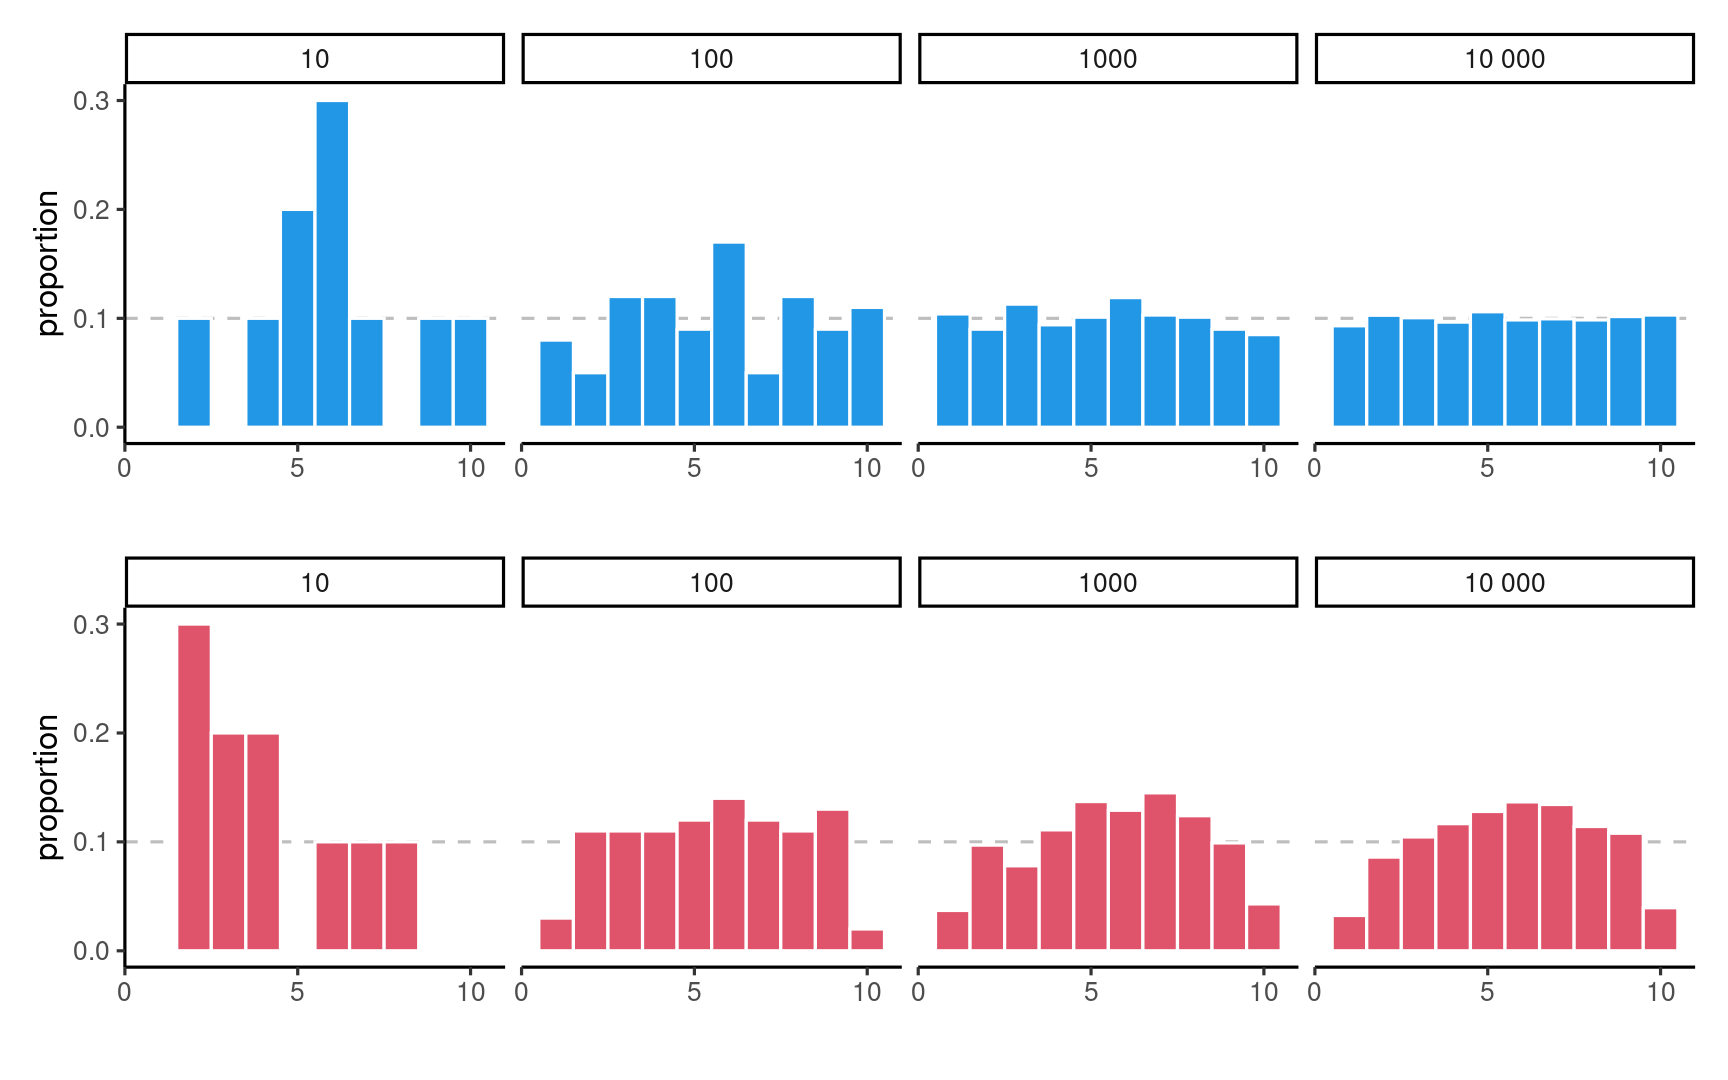
Histograms of data from uniform (top) and non-uniform (bottom) distributions with increasing sample sizes.
Hypothesis tests
The general recipe of hypothesis testing
- Define variables
- Write down hypotheses (null/alternative)
- Choose and compute a test statistic
- Compare the value to the null distribution (benchmark)
- Compute the p-value
- Conclude (reject/fail to reject)
- Report findings
Hypothesis tests versus trials

- Binary decision: guilty/not guilty
- Summarize evidences (proof)
- Assess evidence in light of presumption of innocence
- Verdict: either guilty or not guilty
- Potential for judicial mistakes
How to assess evidence?
statistic = numerical summary of the data.
How to assess evidence?
statistic = numerical summary of the data.
requires benchmark / standardization
typically a unitless quantity
need measure of uncertainty of statistic
General construction principles
Wald statistic
W=estimated qty−postulated qtystd. error (estimated qty)
standard error = measure of variability (same units as obs.)
resulting ratio is unitless!
The standard error is typically function of the sample size and the standard deviation σ of the observations.
Impact of encouragement on teaching
From Davison (2008), Example 9.2
In an investigation on the teaching of arithmetic, 45 pupils were divided at random into five groups of nine. Groups A and B were taught in separate classes by the usual method. Groups C, D, and E were taught together for a number of days. On each day C were praised publicly for their work, D were publicly reproved and E were ignored. At the end of the period all pupils took a standard test.
Basic manipulations in R: load data
data(arithmetic, package = "hecedsm")# categorical variable = factor# Look up datastr(arithmetic)## 'data.frame': 45 obs. of 2 variables:## $ group: Factor w/ 5 levels "control 1","control 2",..: 1 1 1 1 1 1 1 1 1 2 ...## $ score: num 17 14 24 20 24 23 16 15 24 21 ...Basic manipulations in R: summary statistics
# compute summary statisticssummary_stat <- arithmetic |> group_by(group) |> summarize(mean = mean(score), sd = sd(score))knitr::kable(summary_stat, digits = 2)| group | mean | sd |
|---|---|---|
| control 1 | 19.67 | 4.21 |
| control 2 | 18.33 | 3.57 |
| praise | 27.44 | 2.46 |
| reprove | 23.44 | 3.09 |
| ignore | 16.11 | 3.62 |
Basic manipulations in R: plot
# Boxplot with jittered dataggplot(data = arithmetic, aes(x = group, y = score)) + geom_boxplot() + geom_jitter(width = 0.3, height = 0) + theme_bw()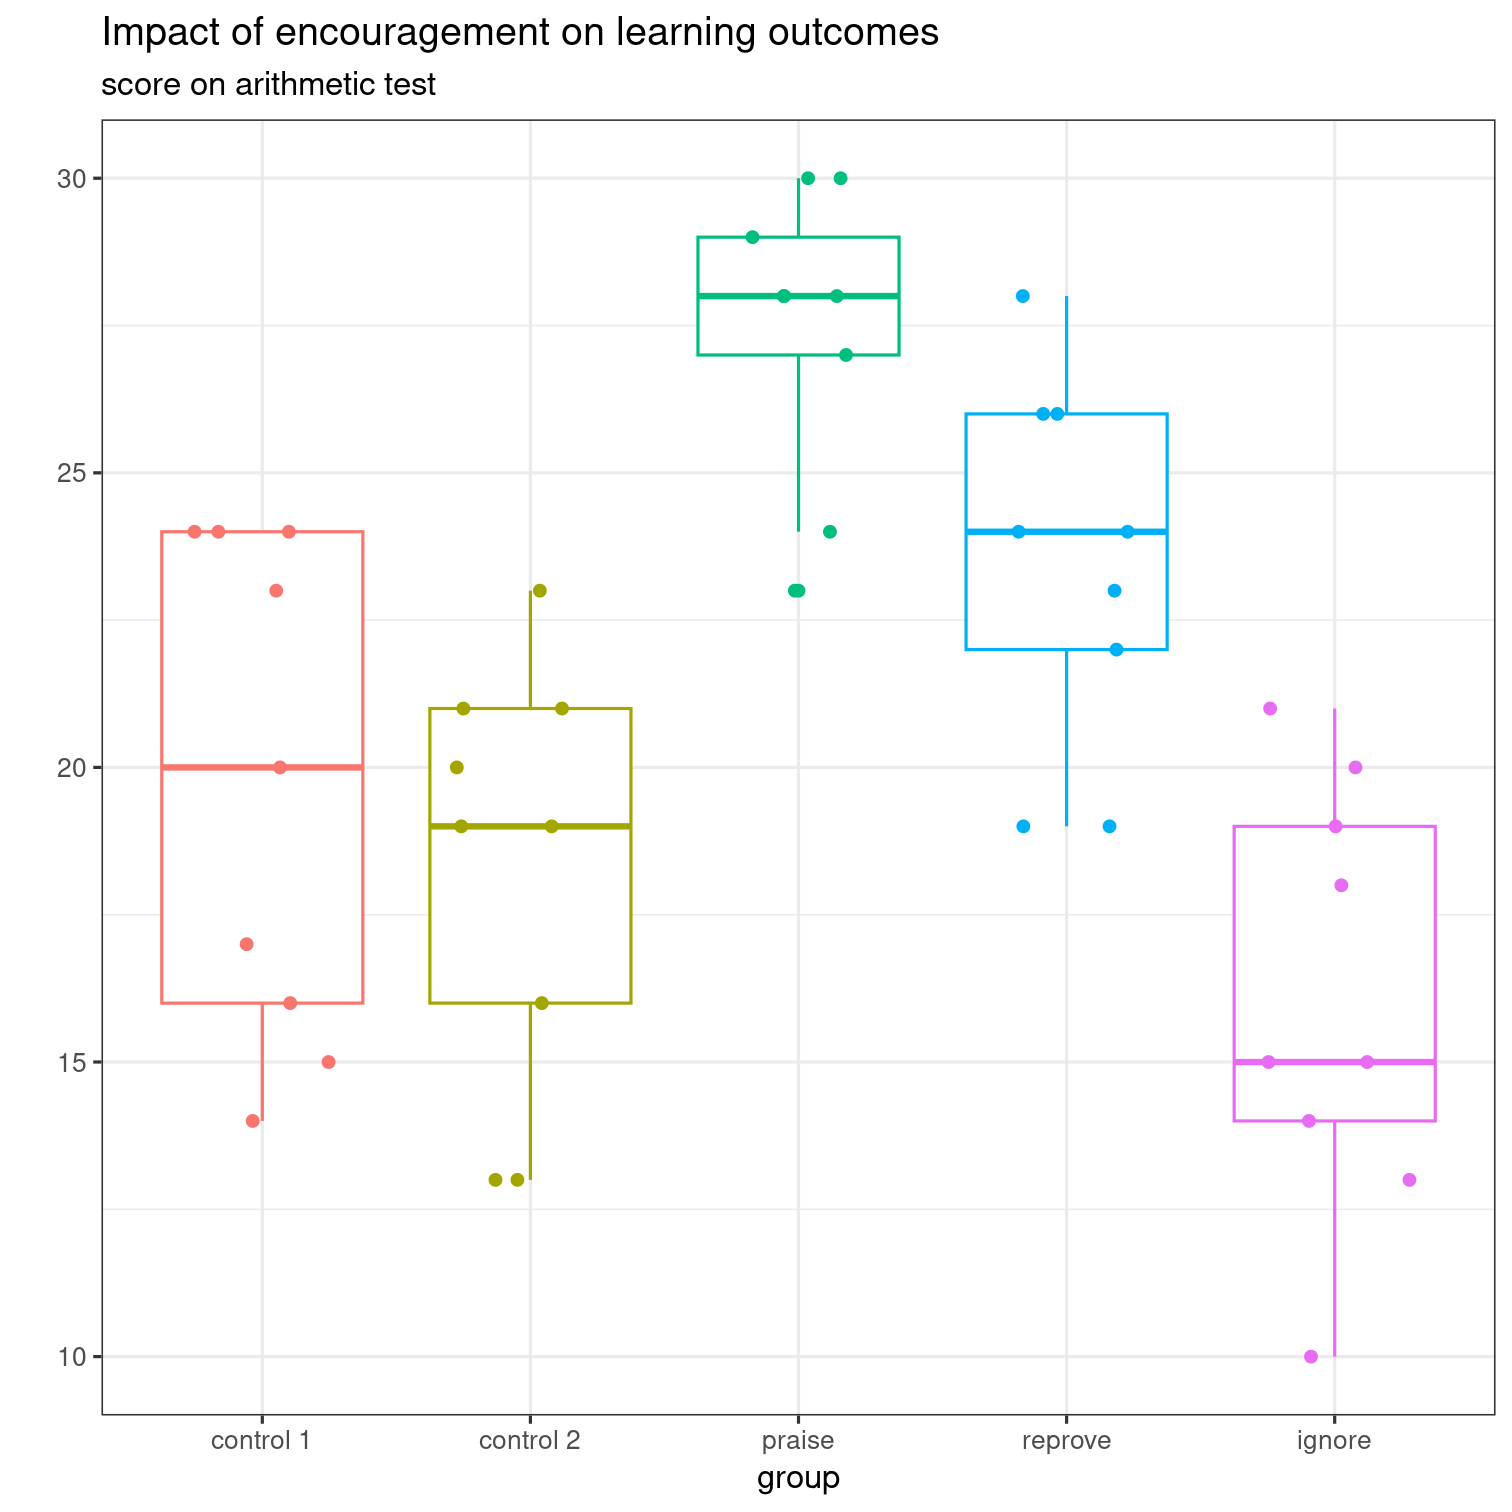
Formulating an hypothesis
Let μC and μD denote the population average (expectation) score for praise and reprove, respectively.
Our null hypothesis is H0:μC=μD against the alternative Ha that they are different (two-sided test).
Equivalent to δCD=μC−μD=0.
Test statistic
The value of the Wald statistic is t=ˆδCD−0se(ˆδCD)=41.6216=2.467
Test statistic
The value of the Wald statistic is t=ˆδCD−0se(ˆδCD)=41.6216=2.467
How 'extreme' is this number?
Could it have happened by chance if there was no difference between groups?
Assessing evidence

Assessing evidence

Benchmarking
- The same number can have different meanings
- units matter!
- Meaningful comparisons require some reference.
Possible, but not plausible
The null distribution tells us what are the plausible values for the statistic and their relative frequency if the null hypothesis holds.
What can we expect to see by chance if there is no difference between groups?
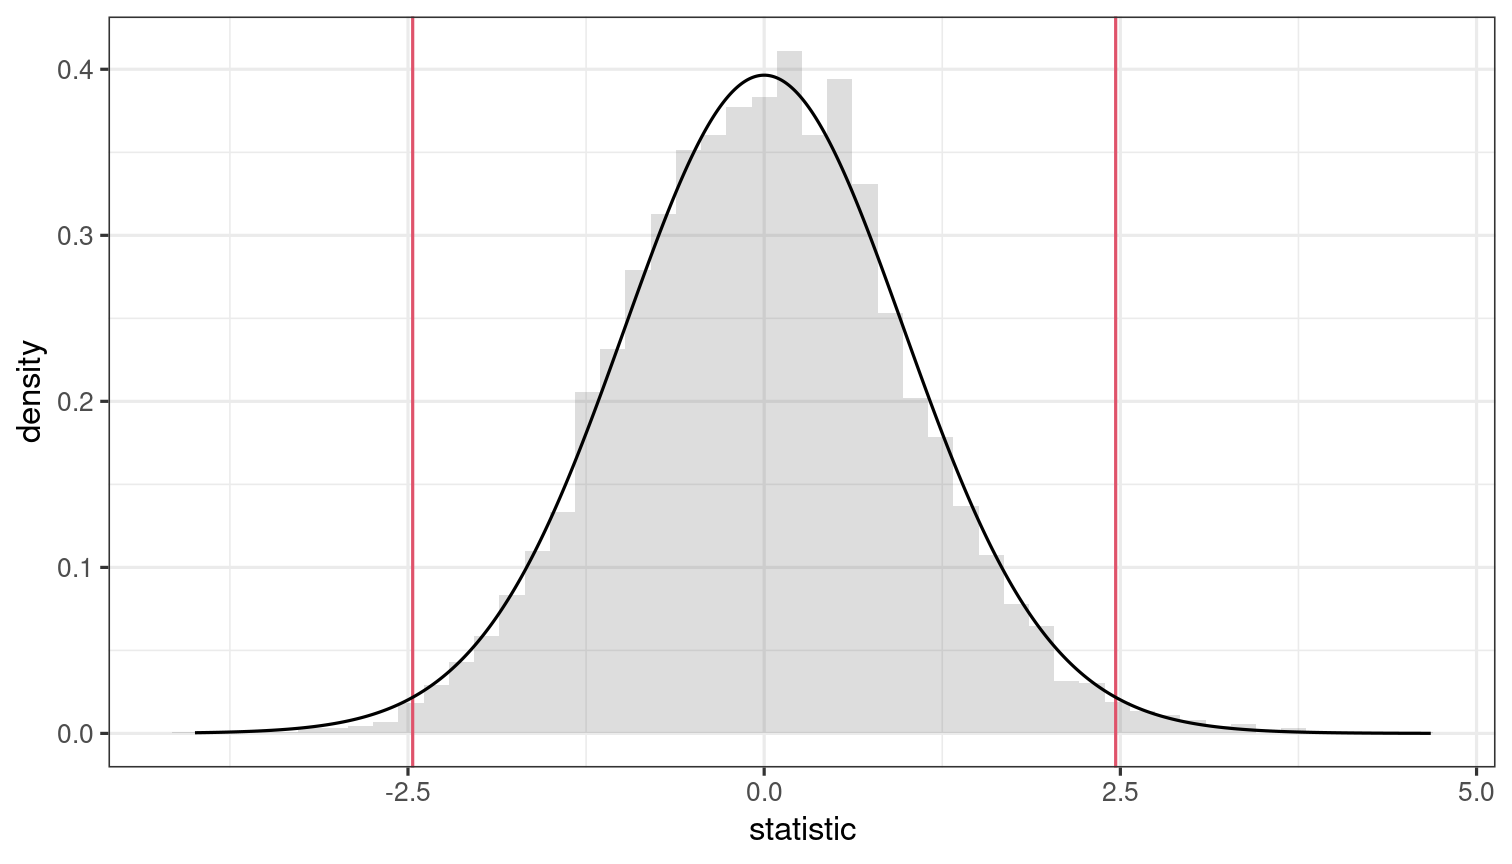
Oftentimes, the null distribution comes with the test statistic
Alternatives include
- Large sample behaviour (asymptotic distribution)
- Resampling/bootstrap/permutation.
P-value
Null distributions are different, which makes comparisons uneasy.
- The p-value gives the probability of observing an outcome as extreme if the null hypothesis was true.
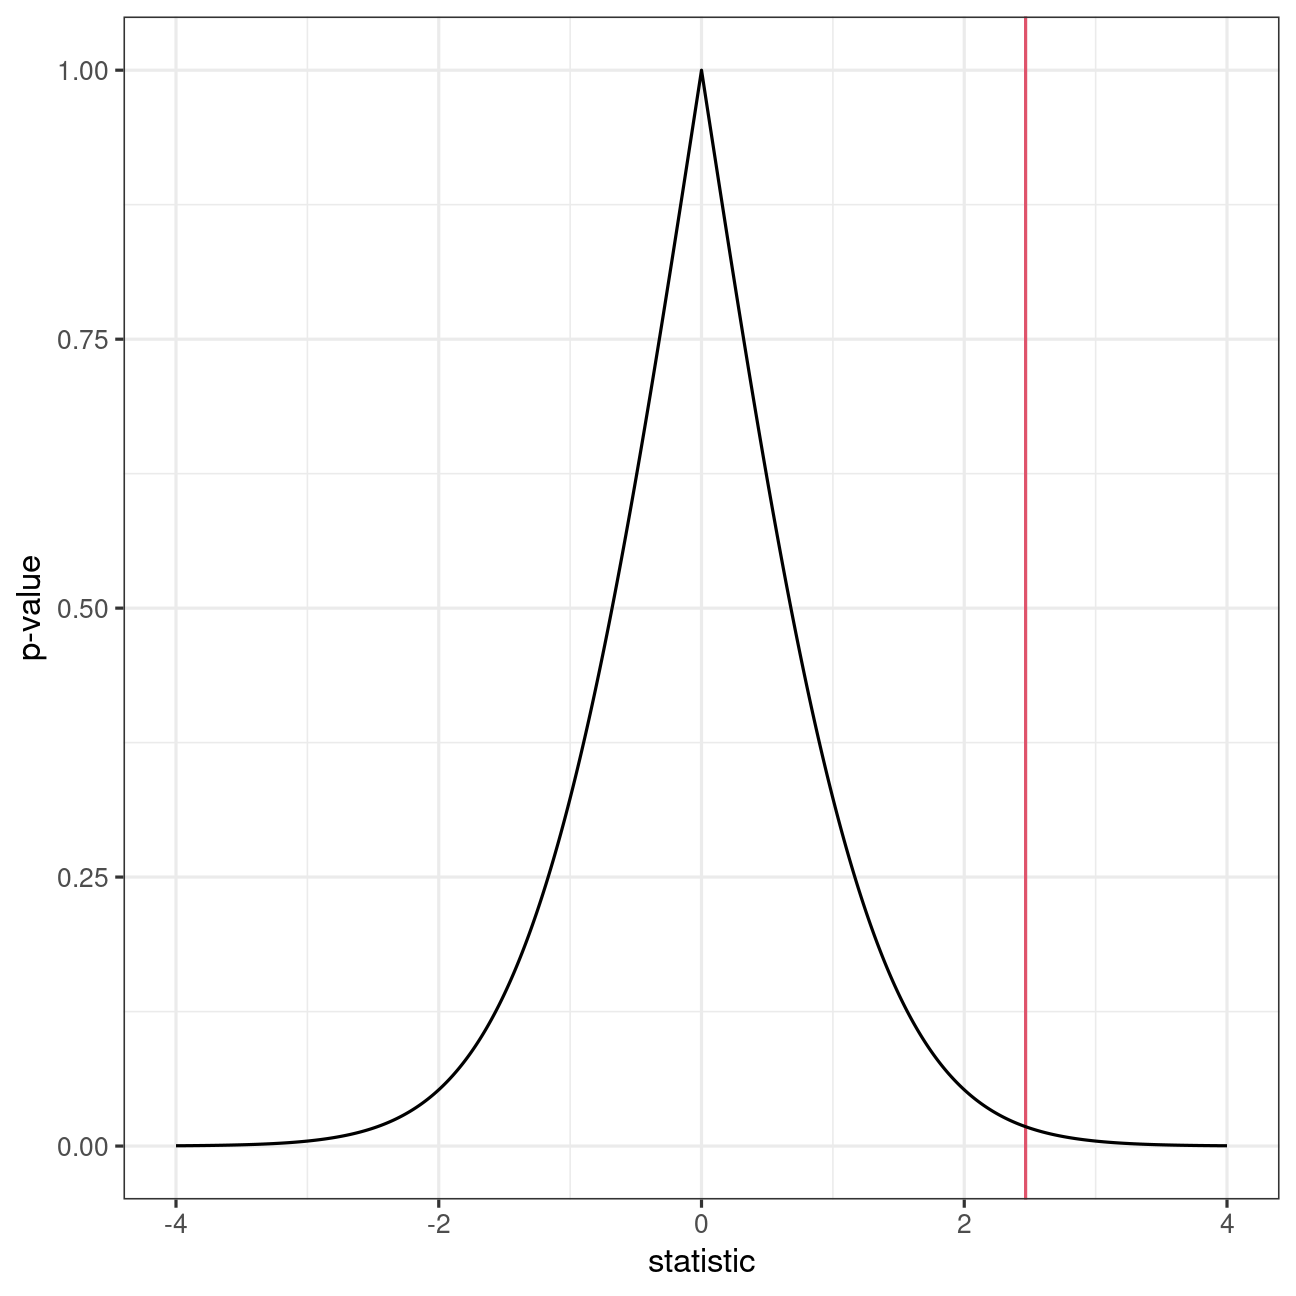
Uniform distribution under H0
Level = probability of condemning an innocent
Fix level α before the experiment.
Choose small α (typical value is 5%)
Reject H0 if p-value less than α
Question: why can't we fix α=0?
What is really a p-value?
The American Statistical Association (ASA) published a statement on (mis)interpretation of p-values.
(2) P-values do not measure the probability that the studied hypothesis is true
(3) Scientific conclusions and business or policy decisions should not be based only on whether a p-value passes a specific threshold.
(4) P-values and related analyses should not be reported selectively
(5) P-value, or statistical significance, does not measure the size of an effect or the importance of a result
Reporting results of a statistical procedure
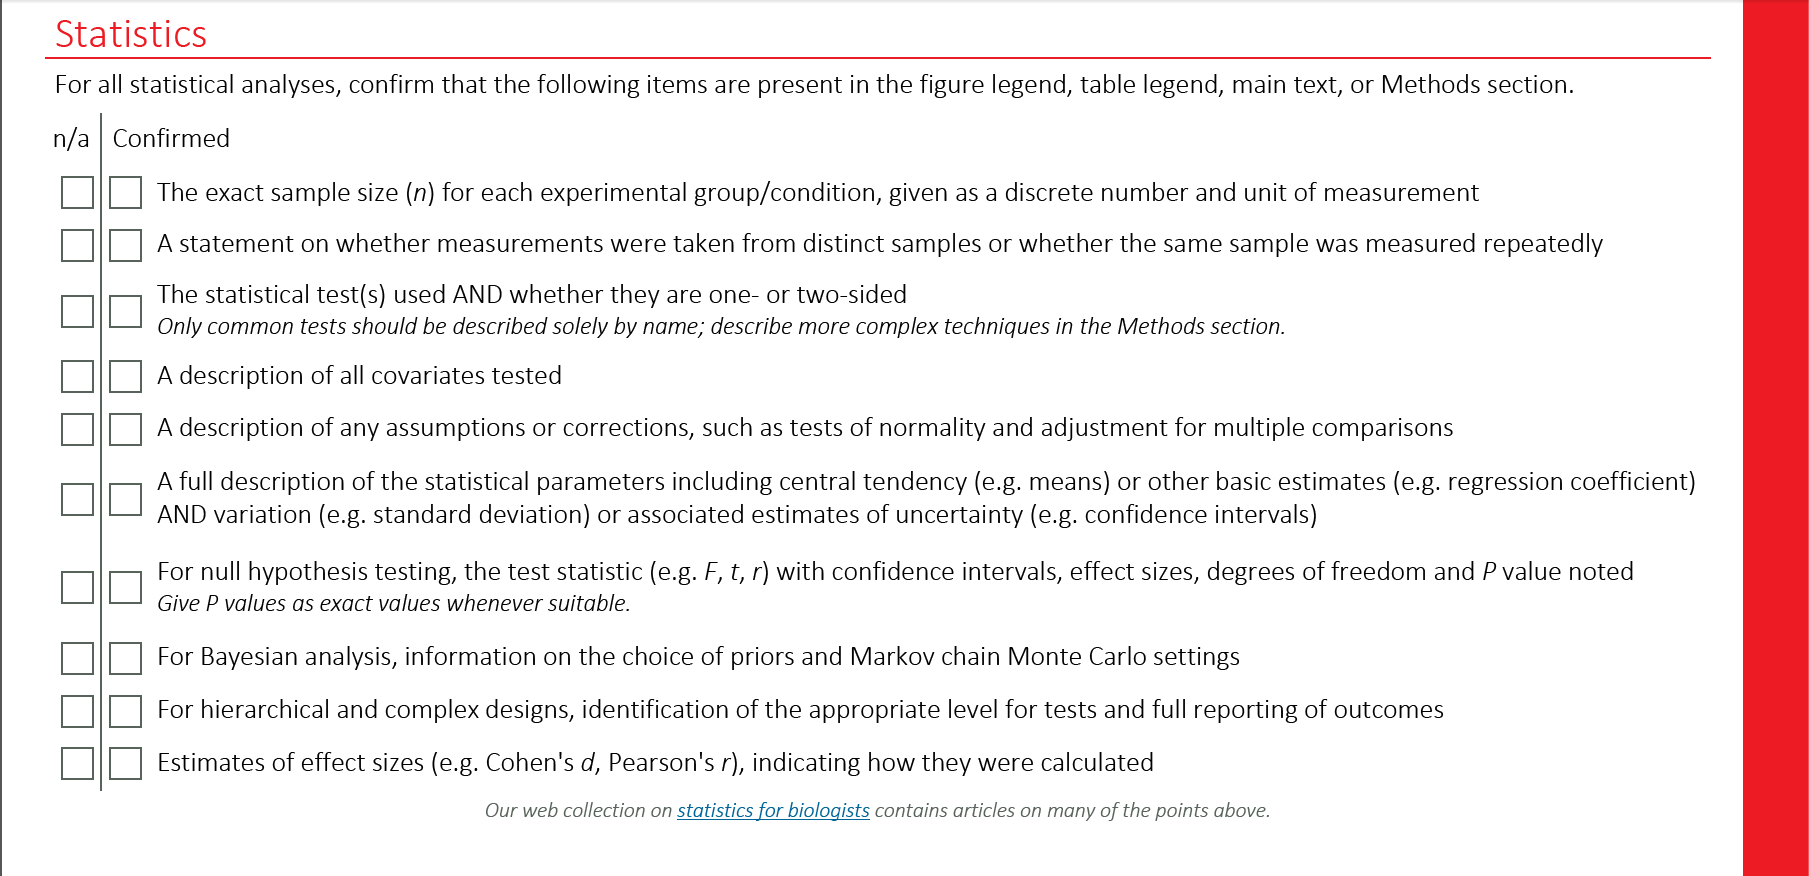
Nature's checklist
Pairwise comparisons
Pairwise differences and t-tests
The p-values and confidence intervals for pairwise differences between groups j and k are based on the t-statistic:
t=estimated−postulated differenceuncertainty=(ˆμj−ˆμk)−(μj−μk)se(ˆμj−ˆμk).
In large sample, this statistic behaves like a Student-t variable with n−K degrees of freedom, denoted St(n−K) hereafter.
Note: in an analysis of variance model, the standard error se(ˆμj−ˆμk) is based the pooled variance estimate (estimated using all observations).
Pairwise differences
Consider the pairwise average difference in scores between the praise (group C) and the reprove (group D) of the arithmetic data.
- Group sample averages are ˆμC=27.4 and ˆμD=23.4
- The estimated average difference between groups C and D is ˆδCD=4
- The estimated pooled standard deviation for the five groups is 1.15ˆδCD
- The standard error for the pairwise difference is se(ˆδCD)=1.6216
- There are n=45 observations and K=5 groups
t-tests: null distribution is Student-t
If we postulate δjk=μj−μk=0, the test statistic becomes
t=ˆδjk−0se(ˆδjk)
The p-value is p=1−Pr(−|t|≤T≤|t|) for T∼Stn−K.
- probability of statistic being more extreme than t
Recall: the larger the values of the statistic t (either positive or negative), the more evidence against the null hypothesis.
Critical values
For a test at level α (two-sided), we fail to reject null hypothesis for all values of the test statistic t that are in the interval
tn−K(α/2)≤t≤tn−K(1−α/2)
Because of the symmetry around zero, tn−K(1−α/2)=−tn−K(α/2).
- We call tn−K(1−α/2) a critical value.
- in R, the quantiles of the Student t distribution are obtained from
qt(1-alpha/2, df = n - K)wherenis the number of observations andKthe number of groups.
Null distribution
The blue area defines the set of values for which we fail to reject null H0.
All values of t falling in the red area lead to rejection at level 5%.
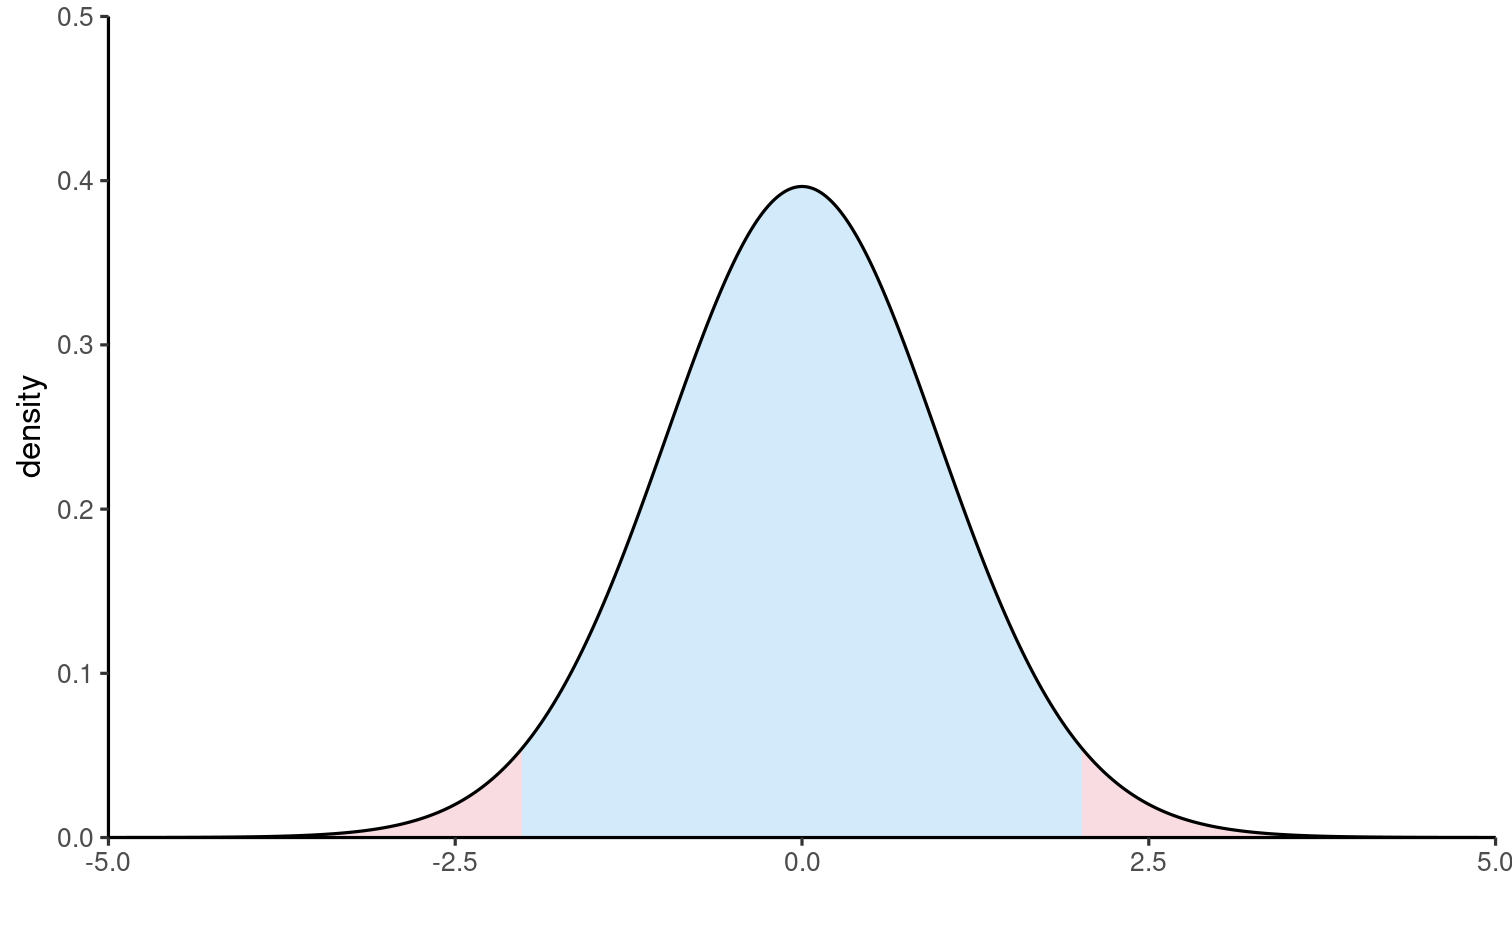
Example
- If H0:δCD=0, the t statistic is t=ˆδCD−0se(ˆδCD)=41.6216=2.467
- The p-value is p=0.018.
- We reject the null at level α=5% since 0.018<0.05.
- Conclude that there is a significant difference at level α=0.05 between the average scores of subpopulations C and D.
Confidence interval
Let δjk=μj−μk denote the population difference, ˆδjk the estimated difference (difference in sample averages) and se(ˆδjk) the estimated standard error.
The region for which we fail to reject the null is −tn−K(1−α/2)≤ˆδjk−δjkse(ˆδjk)≤tn−K(1−α/2) which rearranged gives the (1−α) confidence interval for the (unknown) difference δjk.
ˆδjk−se(ˆδjk)tn−K(1−α/2)≤δjk≤ˆδjk+se(ˆδjk)tn−K(1−α/2)
Interpretation of confidence intervals
The reported confidence interval is of the form
estimate±critical value×standard error
confidence interval = [lower, upper] units
If we replicate the experiment and compute confidence intervals each time
- on average, 95% of those intervals will contain the true value if the assumptions underlying the model are met.
Interpretation in a picture: coin toss analogy
Each interval either contains the true value (black horizontal line) or doesn't.

Why confidence intervals?
Test statistics are standardized,
- Good for comparisons with benchmark
- typically meaningless (standardized = unitless quantities)
Two options for reporting:
- p-value: probability of more extreme outcome if no mean difference
- confidence intervals: set of all values for which we fail to reject the null hypothesis at level α for the given sample
Example
- Mean difference of ˆδCD=4, with se(ˆδCD)=1.6216.
- The critical values for a test at level α=5% are −2.021 and 2.021
qt(0.975, df = 45 - 5)
- Since |t|>2.021, reject H0: the two population are statistically significant at level α=5%.
- The confidence interval is [4−1.6216×2.021,4+1.6216×2.021]=[0.723,7.277]
The postulated value δCD=0 is not in the interval: reject H0.
Pairwise differences in R
library(emmeans) # marginal means and contrastsmodel <- aov(score ~ group, data = arithmetic)margmeans <- emmeans(model, specs = "group")contrast(margmeans, method = "pairwise", adjust = 'none', infer = TRUE) |> as_tibble() |> filter(contrast == "praise - reprove") |> knitr::kable(digits = 3)| contrast | estimate | SE | df | lower.CL | upper.CL | t.ratio | p.value |
|---|---|---|---|---|---|---|---|
| praise - reprove | 4 | 1.622 | 40 | 0.723 | 7.277 | 2.467 | 0.018 |
Recap 1
- Testing procedures factor in the uncertainty inherent to sampling.
- Adopt particular viewpoint: null hypothesis (simpler model, e.g., no difference between group) is true. We consider the evidence under that optic.
Recap 2
- p-values measures compatibility with the null model (relative to an alternative)
- Tests are standardized values,
The output is either a p-value or a confidence interval
- confidence interval: on scale of data (meaningful interpretation)
- p-values: uniform on [0,1] if the null hypothesis is true
Recap 3
- All hypothesis tests share common ingredients
- Many ways, models and test can lead to the same conclusion.
- Transparent reporting is important!