Complete factorial designs
Session 5
MATH 80667A: Experimental Design and Statistical Methods
HEC Montréal
Outline
Factorial designs and interactions
Tests for two-way ANOVA
Factorial designs and interactions
Complete factorial designs?
Factorial design
study with multiple factors (subgroups)
Complete
Gather observations for every subgroup
Motivating example
Response:
retention of information
two hours after reading a story
Population:
children aged four
experimental factor 1:
ending (happy or sad)
experimental factor 2:
complexity (easy, average or hard).
Setup of design
| complexity | happy | sad |
|---|---|---|
| complicated | ||
| average | ||
| easy |
These factors are crossed, meaning that you can have participants in each subconditions.
Efficiency of factorial design
Cast problem
as a series of one-way ANOVA
vs simultaneous estimation
Factorial designs requires
fewer overall observations
Can study interactions
To study each interaction (complexity, story book ending) we would need to make three group for each comparison in rows, and one in each column. So a total of 3 one-way ANOVA each with 2 groups and 2 one-way anova with 3 groups. The two-way ANOVA will lead to 6 groups instead of 12.
Interaction
Definition: when the effect of one factor
depends on the levels of another factor.
Effect together
\(\neq\)
sum of individual effects
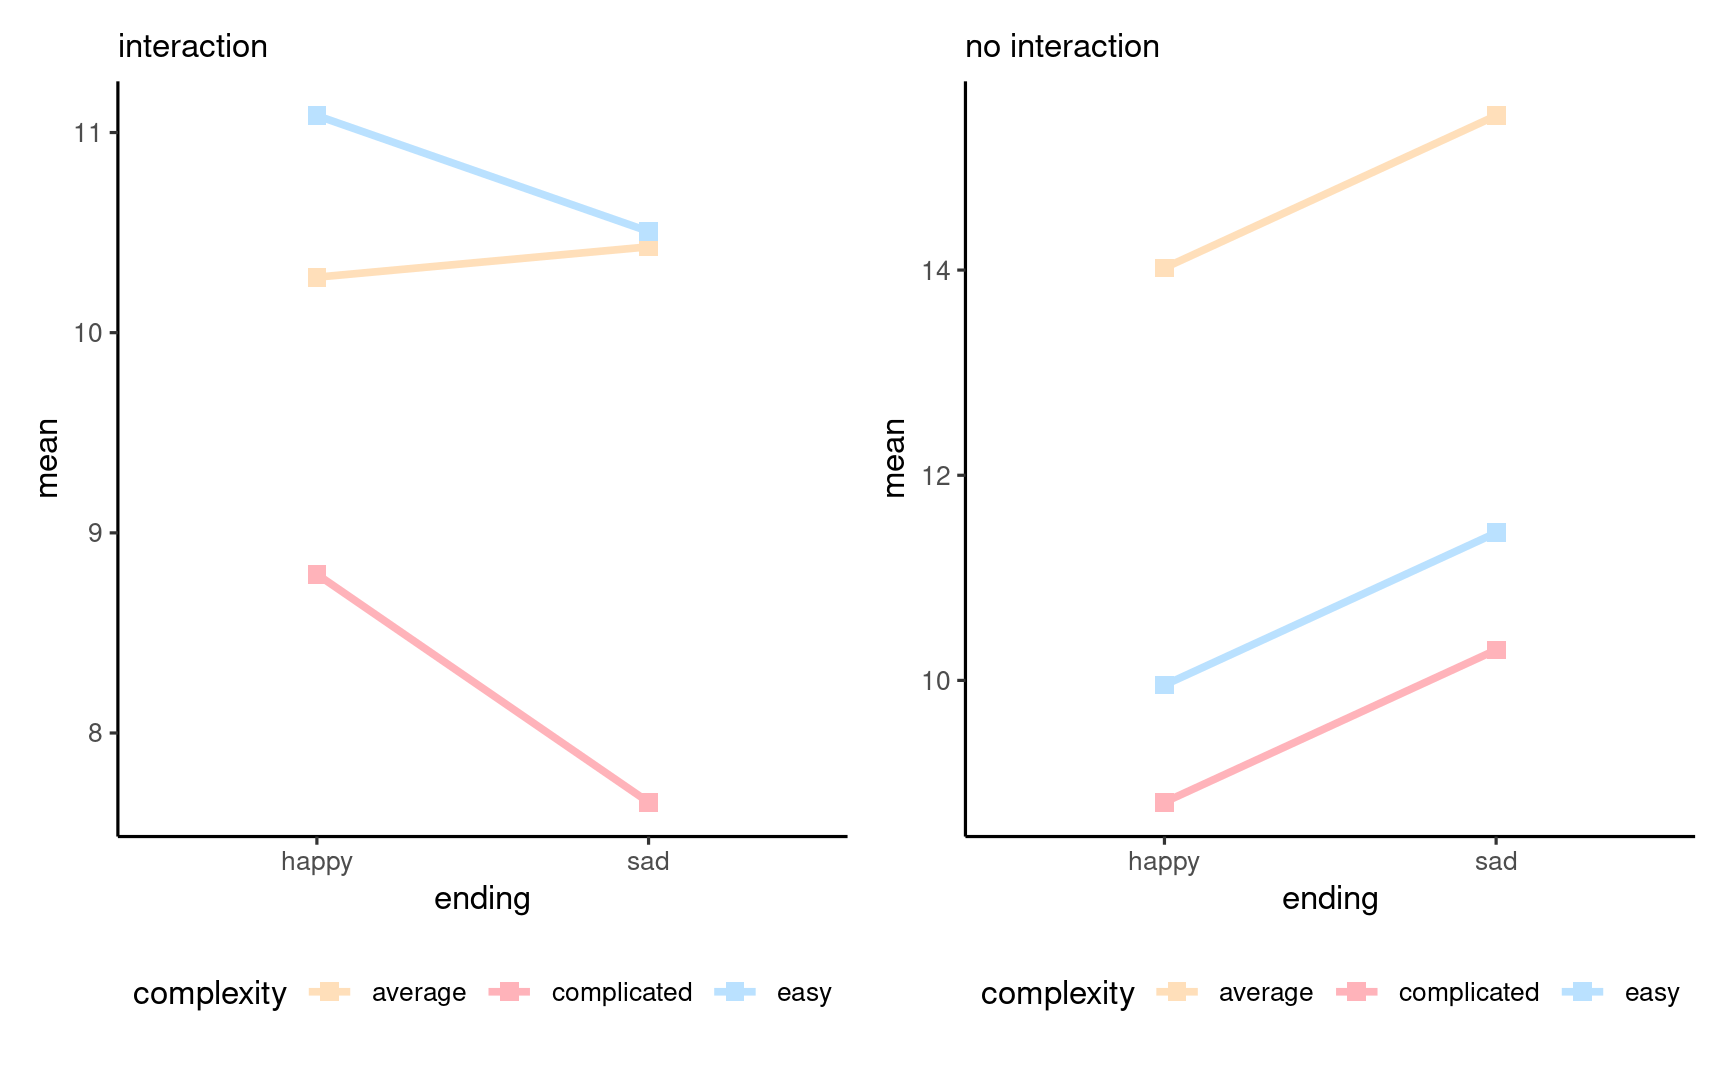
Interaction or profile plot
Graphical display:
plot sample mean per category
with uncertainty measure
(1 std. error for mean
confidence interval, etc.)
Interaction plots and parallel lines

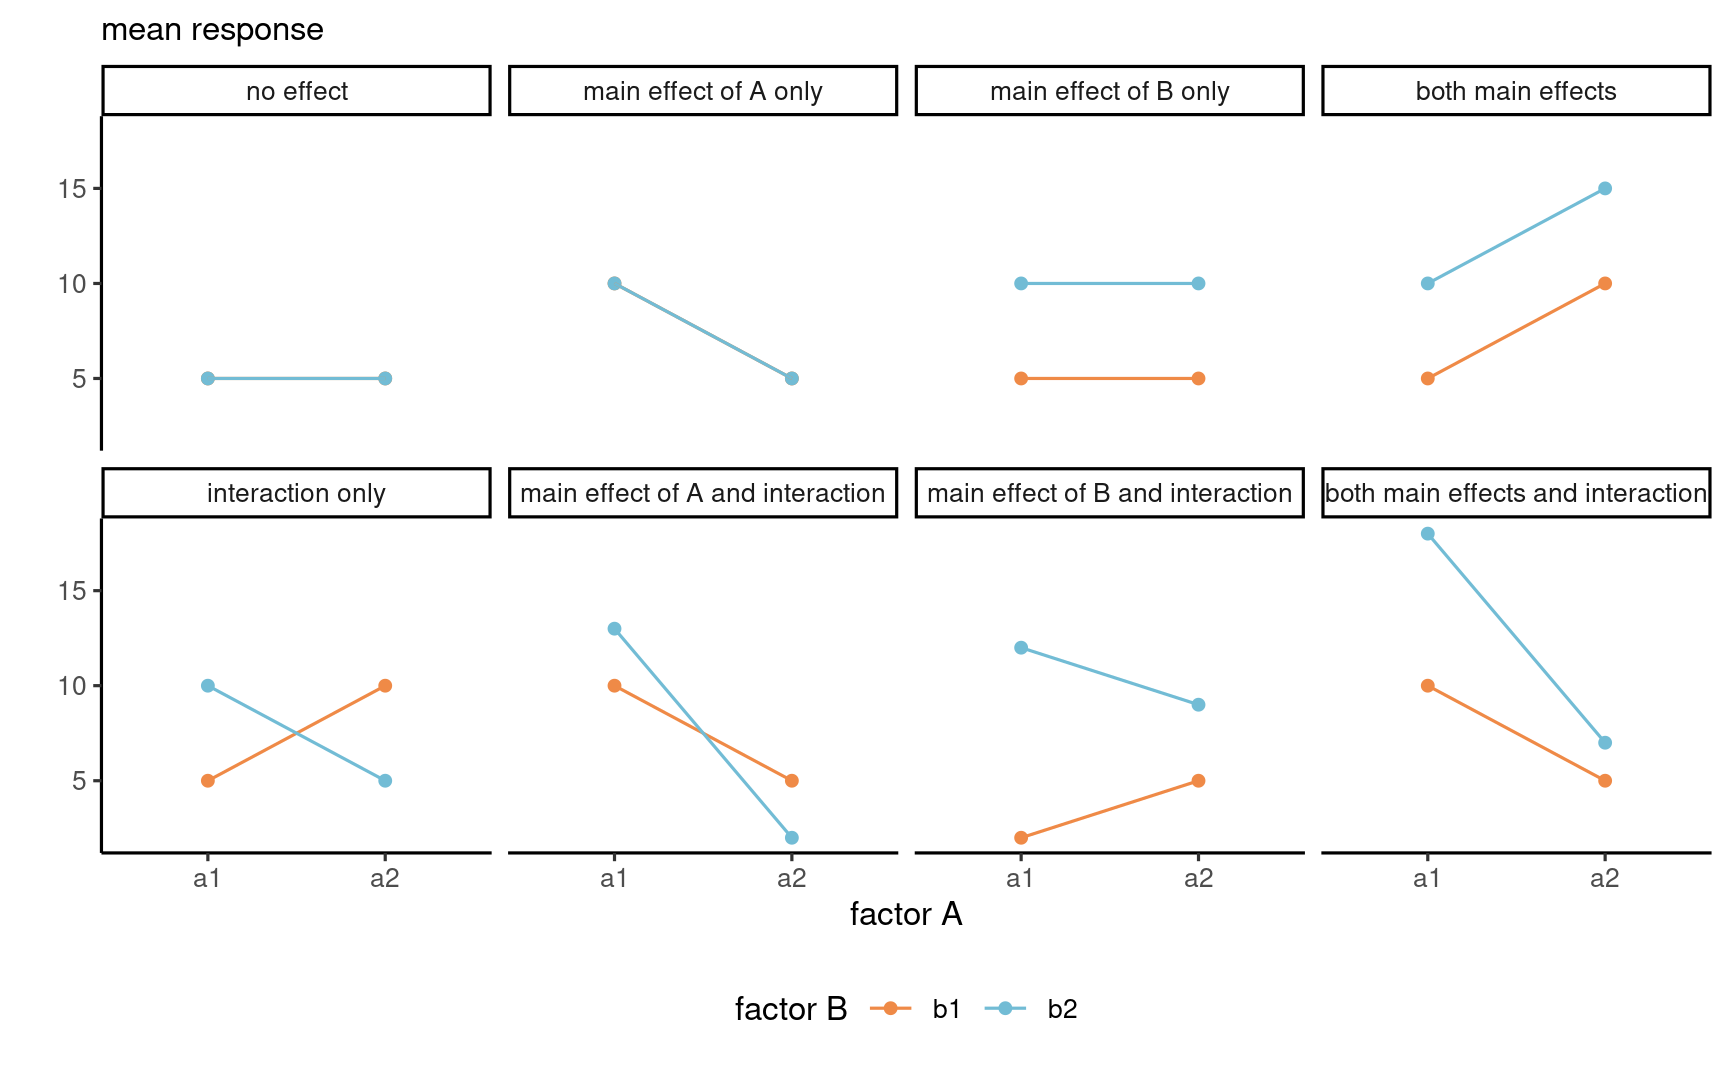
Interaction plots for 2 by 2 designs

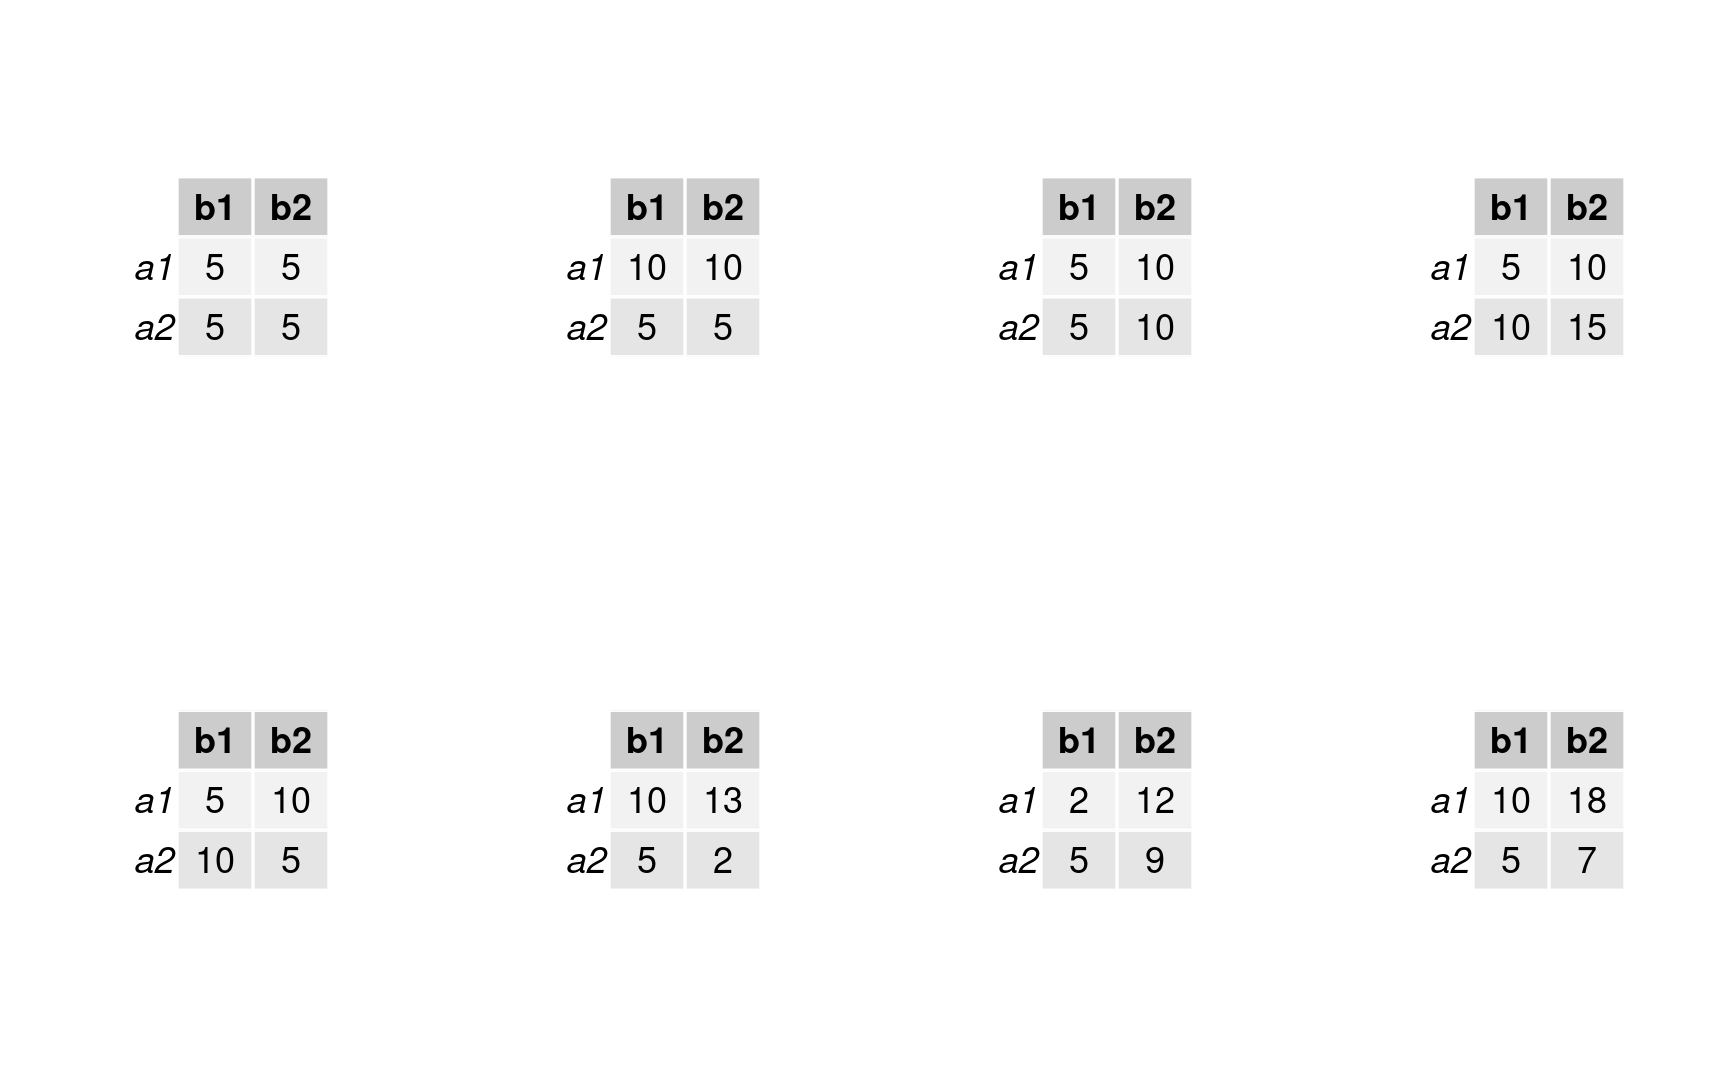
Cell means for 2 by 2 designs

Line graph for example patterns for means for each of the possible kinds of general outcomes in a 2 by 2 design. Illustration adapted from Figure 10.2 of Crump, Navarro and Suzuki (2019) by Matthew Crump (CC BY-SA 4.0 license)
Example 1 : loans versus credit
Sharma, Tully, and Cryder (2021) Supplementary study 5 consists of a \(2 \times 2\) between-subject ANOVA with factors
- debt type (
debttype), either "loan" or "credit" purchasetype, eitherdiscretionaryor not (need)
 No evidence of interaction
Example 2 - psychological distance
Maglio and Polman (2014) Study 1 uses a \(4 \times 2\) between-subject ANOVA with factors
- subway
station, one of Spadina, St. George, Bloor-Yonge and Sherbourne directionof travel, either east or west
 Clear evidence of interaction (symmetry?)
Tests for two-way ANOVA
Analysis of variance = regression
An analysis of variance model is simply a linear regression with categorical covariate(s).
- Typically, the parametrization is chosen so that parameters reflect differences to the global mean (sum-to-zero parametrization).
- The full model includes interactions between all combinations of factors
- one average for each subcategory
- one-way ANOVA!
Formulation of the two-way ANOVA
Two factors: \(A\) (complexity) and \(B\) (ending) with \(n_a=3\) and \(n_b=2\) levels, and their interaction.
Write the average response \(Y_{ijr}\) of the \(r\)th measurement in group \((a_i, b_j)\) as \begin{align*} \underset{\text{average response}\vphantom{b}}{\mathsf{E}(Y_{ijr})} = \underset{\text{subgroup mean}}{\mu_{ij}} \end{align*} where \(Y_{ijr}\) are independent observations with a common std. deviation \(\sigma\).
- We estimate \(\mu_{ij}\) by the sample mean of the subgroup \((i,j)\), say \(\widehat{\mu}_{ij}\).
- The fitted values are \(\widehat{y}_{ijr} = \widehat{\mu}_{ij}\).
One average for each subgroup
\(\qquad B\) ending\(A\) complexity \(\qquad\) |
\(b_1\) (happy) |
\(b_2\) (sad) |
row mean |
|---|---|---|---|
\(a_1\) (complicated) |
\(\mu_{11}\) | \(\mu_{12}\) | \(\mu_{1.}\) |
\(a_2\) (average) |
\(\mu_{21}\) | \(\mu_{22}\) | \(\mu_{2.}\) |
\(a_3\) (easy) |
\(\mu_{31}\) | \(\mu_{32}\) | \(\mu_{3.}\) |
| column mean | \(\mu_{.1}\) | \(\mu_{.2}\) | \(\mu\) |
Row, column and overall average
Mean of \(A_i\) (average of row \(i\)): $$\mu_{i.} = \frac{\mu_{i1} + \cdots + \mu_{in_b}}{n_b}$$
Mean of \(B_j\) (average of column \(j\)): $$\mu_{.j} = \frac{\mu_{1j} + \cdots + \mu_{n_aj}}{n_a}$$
- Overall average: $$\mu = \frac{\sum_{i=1}^{n_a} \sum_{j=1}^{n_b} \mu_{ij}}{n_an_b}$$
- Row, column and overall averages are equiweighted combinations of the cell means \(\mu_{ij}\).
- Estimates are obtained by replacing \(\mu_{ij}\) in formulas by subgroup sample mean.
Vocabulary of effects
- simple effects: difference between levels of one in a fixed combination of others (change in difficulty for happy ending)
- main effects: differences relative to average for each condition of a factor (happy vs sad ending)
- interaction effects: when simple effects differ depending on levels of another factor
Main effects
Main effects are comparisons between row or column averages
Obtained by marginalization, i.e., averaging over the other dimension.
Main effects are not of interest if there is an interaction.
| happy | sad | |
|---|---|---|
| column means | $$\mu_{.1}$$ | $$\mu_{.2}$$ |
| complexity | row means |
|---|---|
| complicated | $$\mu_{1.}$$ |
| average | $$\mu_{2.}$$ |
| easy | $$\mu_{3.}$$ |
Simple effects
Simple effects are comparisons between cell averages within a given row or column
| happy | sad | |
|---|---|---|
| means (easy) | $$\mu_{13}$$ | $$\mu_{23}$$ |
| complexity | mean (happy) |
|---|---|
| complicated | $$\mu_{11}$$ |
| average | $$\mu_{21}$$ |
| easy | $$\mu_{31}$$ |
Contrasts
We collapse categories to obtain a one-way ANOVA with categories \(A\) (complexity) and \(B\) (ending).
Q: How would you write the weights for contrasts for testing the
- main effect of \(A\): complicated vs average, or complicated vs easy.
- main effect of \(B\): happy vs sad.
- interaction \(A\) and \(B\): difference between complicated and average, for happy versus sad?
The order of the categories is \((a_1, b_1)\), \((a_1, b_2)\), \(\ldots\), \((a_3, b_2)\).
Contrasts
Suppose the order of the coefficients is factor \(A\) (complexity, 3 levels, complicated/average/easy) and factor \(B\) (ending, 2 levels, happy/sad).
| test | \(\mu_{11}\) | \(\mu_{12}\) | \(\mu_{21}\) | \(\mu_{22}\) | \(\mu_{31}\) | \(\mu_{32}\) |
|---|---|---|---|---|---|---|
| main effect \(A\) (complicated vs average) | \(1\) | \(1\) | \(-1\) | \(-1\) | \(0\) | \(0\) |
| main effect \(A\) (complicated vs easy) | \(1\) | \(1\) | \(0\) | \(0\) | \(-1\) | \(-1\) |
| main effect \(B\) (happy vs sad) | \(1\) | \(-1\) | \(1\) | \(-1\) | \(1\) | \(-1\) |
| interaction \(AB\) (comp. vs av, happy vs sad) | \(1\) | \(-1\) | \(-1\) | \(1\) | \(0\) | \(0\) |
| interaction \(AB\) (comp. vs easy, happy vs sad) | \(1\) | \(-1\) | \(0\) | \(0\) | \(-1\) | \(1\) |
Global hypothesis tests
Main effect of factor \(A\)
\(\mathscr{H}_0\): \(\mu_{1.} = \cdots = \mu_{n_a.}\) vs \(\mathscr{H}_a\): at least two marginal means of \(A\) are different
Main effect of factor \(B\)
\(\mathscr{H}_0\): \(\mu_{.1} = \cdots = \mu_{.n_b}\) vs \(\mathscr{H}_a\): at least two marginal means of \(B\) are different
Interaction
\(\mathscr{H}_0\): \(\mu_{ij} = \mu_{i \cdot} + \mu_{\cdot j}\) (sum of main effects) vs \(\mathscr{H}_a\): effect is not a combination of row/column effect.
Comparing nested models
Rather than present the specifics of ANOVA, we consider a general hypothesis testing framework which is more widely applicable.
We compare two competing models, \(\mathbb{M}_a\) and \(\mathbb{M}_0\).
- the alternative or full model \(\mathbb{M}_a\) under the alternative \(\mathscr{H}_a\) with \(p\) parameters for the mean
- the simpler null model \(\mathbb{M}_0\) under the null \(\mathscr{H}_0\), which imposes \(\nu\) restrictions on the full model
The same holds for analysis of deviance for generalized linear models. The latter use likelihood ratio tests (which are equivalent to F-tests for linear models), with a \(\chi^2_{\nu}\) null distribution.
Intuition behind \(F\)-test for ANOVA
The residual sum of squares measures how much variability is leftover, $$\mathsf{RSS}_a = \sum_{i=1}^n \left(y_i - \widehat{y}_i^{\mathbb{M}_a}\right)^2$$ where \(\widehat{y}_i\) is the estimated mean under model \(\mathbb{M}_a\) for the observation \(y_i\).
The more complex fits better (it is necessarily more flexible), but requires estimation of more parameters.
- We wish to assess the improvement that would occur by chance, if the null model was correct.
Testing linear restrictions in linear models
If the alternative model has \(p\) parameters for the mean, and we impose \(\nu\) linear restrictions under the null hypothesis to the model estimated based on \(n\) independent observations, the test statistic is
\begin{align*} F = \frac{(\mathsf{RSS}_0 - \mathsf{RSS}_a)/\nu}{\mathsf{RSS}_a/(n-p)} \end{align*}
- The numerator is the difference in residuals sum of squares, denoted \(\mathsf{RSS}\), from models fitted under \(\mathscr{H}_0\) and \(\mathscr{H}_a\), divided by degrees of freedom \(\nu\).
- The denominator is an estimator of the variance, obtained under \(\mathscr{H}_a\) (termed mean squared error of residuals)
- The benchmark for tests in linear models is Fisher's \(\mathsf{F}(\nu, n-p)\).
Analysis of variance table
| term | degrees of freedom | mean square | \(F\) |
|---|---|---|---|
| \(A\) | \(n_a-1\) | \(\mathsf{MS}_{A}=\mathsf{SS}_A/(n_a-1)\) | \(\mathsf{MS}_{A}/\mathsf{MS}_{\text{res}}\) |
| \(B\) | \(n_b-1\) | \(\mathsf{MS}_{B}=\mathsf{SS}_B/(n_b-1)\) | \(\mathsf{MS}_{B}/\mathsf{MS}_{\text{res}}\) |
| \(AB\) | \((n_a-1)(n_b-1)\) | \(\mathsf{MS}_{AB}=\mathsf{SS}_{AB}/\{(n_a-1)(n_b-1)\}\) | \(\mathsf{MS}_{AB}/\mathsf{MS}_{\text{res}}\) |
| residuals | \(n-n_an_b\) | \(\mathsf{MS}_{\text{resid}}=\mathsf{RSS}_{a}/ (n-n_an_b)\) | |
| total | \(n-1\) |
Read the table backward (starting with the interaction).
- If there is a significant interaction, the main effects are not of interest and potentially misleading.
Intuition behind degrees of freedom
The model always includes an overall average \(\mu\). There are
- \(n_a-1\) free row means since \(n_a\mu = \mu_{1.} + \cdots + \mu_{n_a.}\)
- \(n_b-1\) free column means as \(n_b\mu = \mu_{.1} + \cdots + \mu_{.n_b}\)
- \(n_an_b-(n_a-1)-(n_b-1)-1\) interaction terms
\(\qquad B\) ending\(A\) complexity \(\qquad\) |
\(b_1\) (happy) |
\(b_2\) (sad) |
row mean |
|---|---|---|---|
\(a_1\) (complicated) |
\(\mu_{11}\) | \(\mathsf{X}\) | \(\mu_{1.}\) |
\(a_2\) (average) |
\(\mu_{21}\) | \(\mathsf{X}\) | \(\mu_{2.}\) |
\(a_3\) (easy) |
\(\mathsf{X}\) | \(\mathsf{X}\) | \(\mathsf{X}\) |
| column mean | \(\mu_{.1}\) | \(\mathsf{X}\) | \(\mu\) |
Terms with \(\mathsf{X}\) are fully determined by row/column/total averages
Example 1
The interaction plot suggested that the two-way interaction wasn't significant. The \(F\) test confirms this.
There is a significant main effect of both purchase and debttype.
| term | SS | df | F stat | p-value |
|---|---|---|---|---|
| purchase | 752.3 | 1 | 98.21 | < .001 |
| debttype | 92.2 | 1 | 12.04 | < .001 |
| purchase:debttype | 13.7 | 1 | 1.79 | .182 |
| Residuals | 11467.4 | 1497 |
Example 2
There is a significant interaction between station and direction, so follow-up by looking at simple effects or contrasts.
The tests for the main effects are not of interest! Disregard other entries of the ANOVA table
| term | SS | df | F stat | p-value |
|---|---|---|---|---|
| station | 75.2 | 3 | 23.35 | < .001 |
| direction | 0.4 | 1 | 0.38 | .541 |
| station:direction | 52.4 | 3 | 16.28 | < .001 |
| Residuals | 208.2 | 194 |
Main effects for Example 1
We consider differences between debt type labels.
Participants are more likely to consider the offer if it is branded as credit than loan. The difference is roughly 0.5 (on a Likert scale from 1 to 9).
## $emmeans## debttype emmean SE df lower.CL upper.CL## credit 5.12 0.101 1497 4.93 5.32## loan 4.63 0.101 1497 4.43 4.83## ## Results are averaged over the levels of: purchase ## Confidence level used: 0.95 ## ## $contrasts## contrast estimate SE df t.ratio p.value## credit - loan 0.496 0.143 1497 3.469 0.0005## ## Results are averaged over the levels of: purchaseToronto subway station

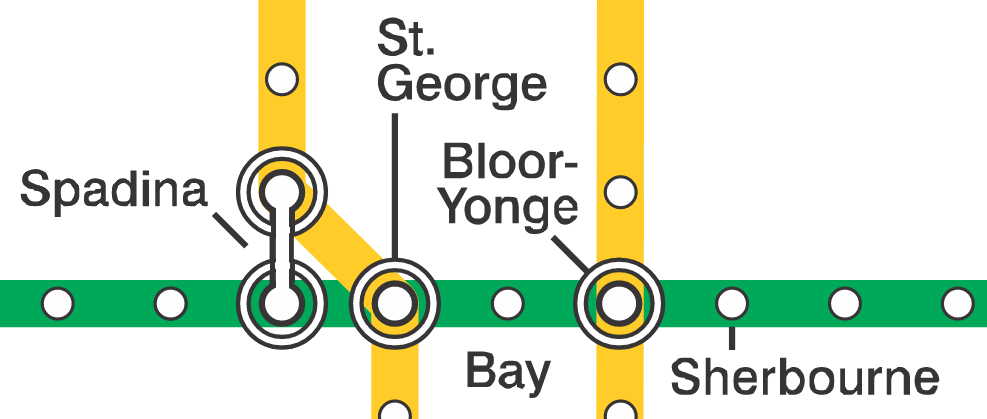
Simplified depiction of the Toronto metro stations used in the experiment, based on work by Craftwerker on Wikipedia, distributed under CC-BY-SA 4.0.
Reparametrization for Example 2
Set stdist as \(-2\), \(-1\), \(+1\), \(+2\) to indicate station distance, with negative signs indicating stations in opposite direction of travel
The ANOVA table for the reparametrized models shows no evidence against the null of symmetry (interaction).
| term | SS | df | F stat | p-value |
|---|---|---|---|---|
| stdist | 121.9 | 3 | 37.86 | < .001 |
| direction | 0.4 | 1 | 0.35 | .554 |
| stdist:direction | 5.7 | 3 | 1.77 | .154 |
| Residuals | 208.2 | 194 |
Interaction plot for reformated data

Custom contrasts for Example 2
We are interested in testing the perception of distance, by looking at \(\mathscr{H}_0: \mu_{-1} = \mu_{+1}, \mu_{-2} = \mu_{+2}\).
mod3 <- lm(distance ~ stdist * direction, data = MP14_S1) (emm <- emmeans(mod3, specs = "stdist")) # order is -2, -1, 1, 2contrasts <- emm |> contrast( list("two dist" = c(-1, 0, 0, 1), "one dist" = c(0, -1, 1, 0)))contrasts # print pairwise contraststest(contrasts, joint = TRUE)Estimated marginal means and contrasts
Strong evidence of differences in perceived distance depending on orientation.
## stdist emmean SE df lower.CL upper.CL## -2 3.83 0.145 194 3.54 4.11## -1 2.48 0.144 194 2.20 2.76## +1 1.62 0.150 194 1.33 1.92## +2 2.70 0.145 194 2.42 2.99## ## Results are averaged over the levels of: direction ## Confidence level used: 0.95## contrast estimate SE df t.ratio p.value## two dist -1.122 0.205 194 -5.470 <.0001## one dist -0.856 0.207 194 -4.129 0.0001## ## Results are averaged over the levels of: direction## df1 df2 F.ratio p.value## 2 194 23.485 <.0001