Introduction to mixed models
Session 10
MATH 80667A: Experimental Design and Statistical Methods
HEC Montréal
Outline
Blocking
Mixed effects
Blocking
Terminology for nuisance
Block
Source of variation, but of no interest
known and controllable
Example
timing
lab technician
machine
Noise factor
Under which setting is response least affected?
Example
temperature
processing
Example 15.2.3 in Dean & Voss of Lipton soup mixture
A: number of mixer ports through which vegetable oil was added (two levels, 1 and 3); B: temperature of mixer jacket (two levels; ambient temperature, presence of cooling water); C: mixing time (two levels; 60 and 80 sec); D: batch weight (two levels; 1500 and 2000 lb); E: delay between mixing and packaging (two levels; 1 day and 7 days).
Why blocking?
Design experiment to reduce the effect of uncontrolled variations
In general, increases the power of the F test for treatment effects.
Group units in sets as alike as possible.
(Often) compare only treatments, so interactions are not included.
Assignment to treatment
Divide subjects within each block
Randomly allocate to treatment within block
(stratified sampling)
Block-treatment design
Linear model (two-way ANOVA) without interaction,
Yijresponseb=μβjglobal mean+αiβjtreatmentb+βjblocking+εijβjerrorb
Compromise between
- reduced variability for residuals,
- loss of degrees of freedom due to estimation of β's.
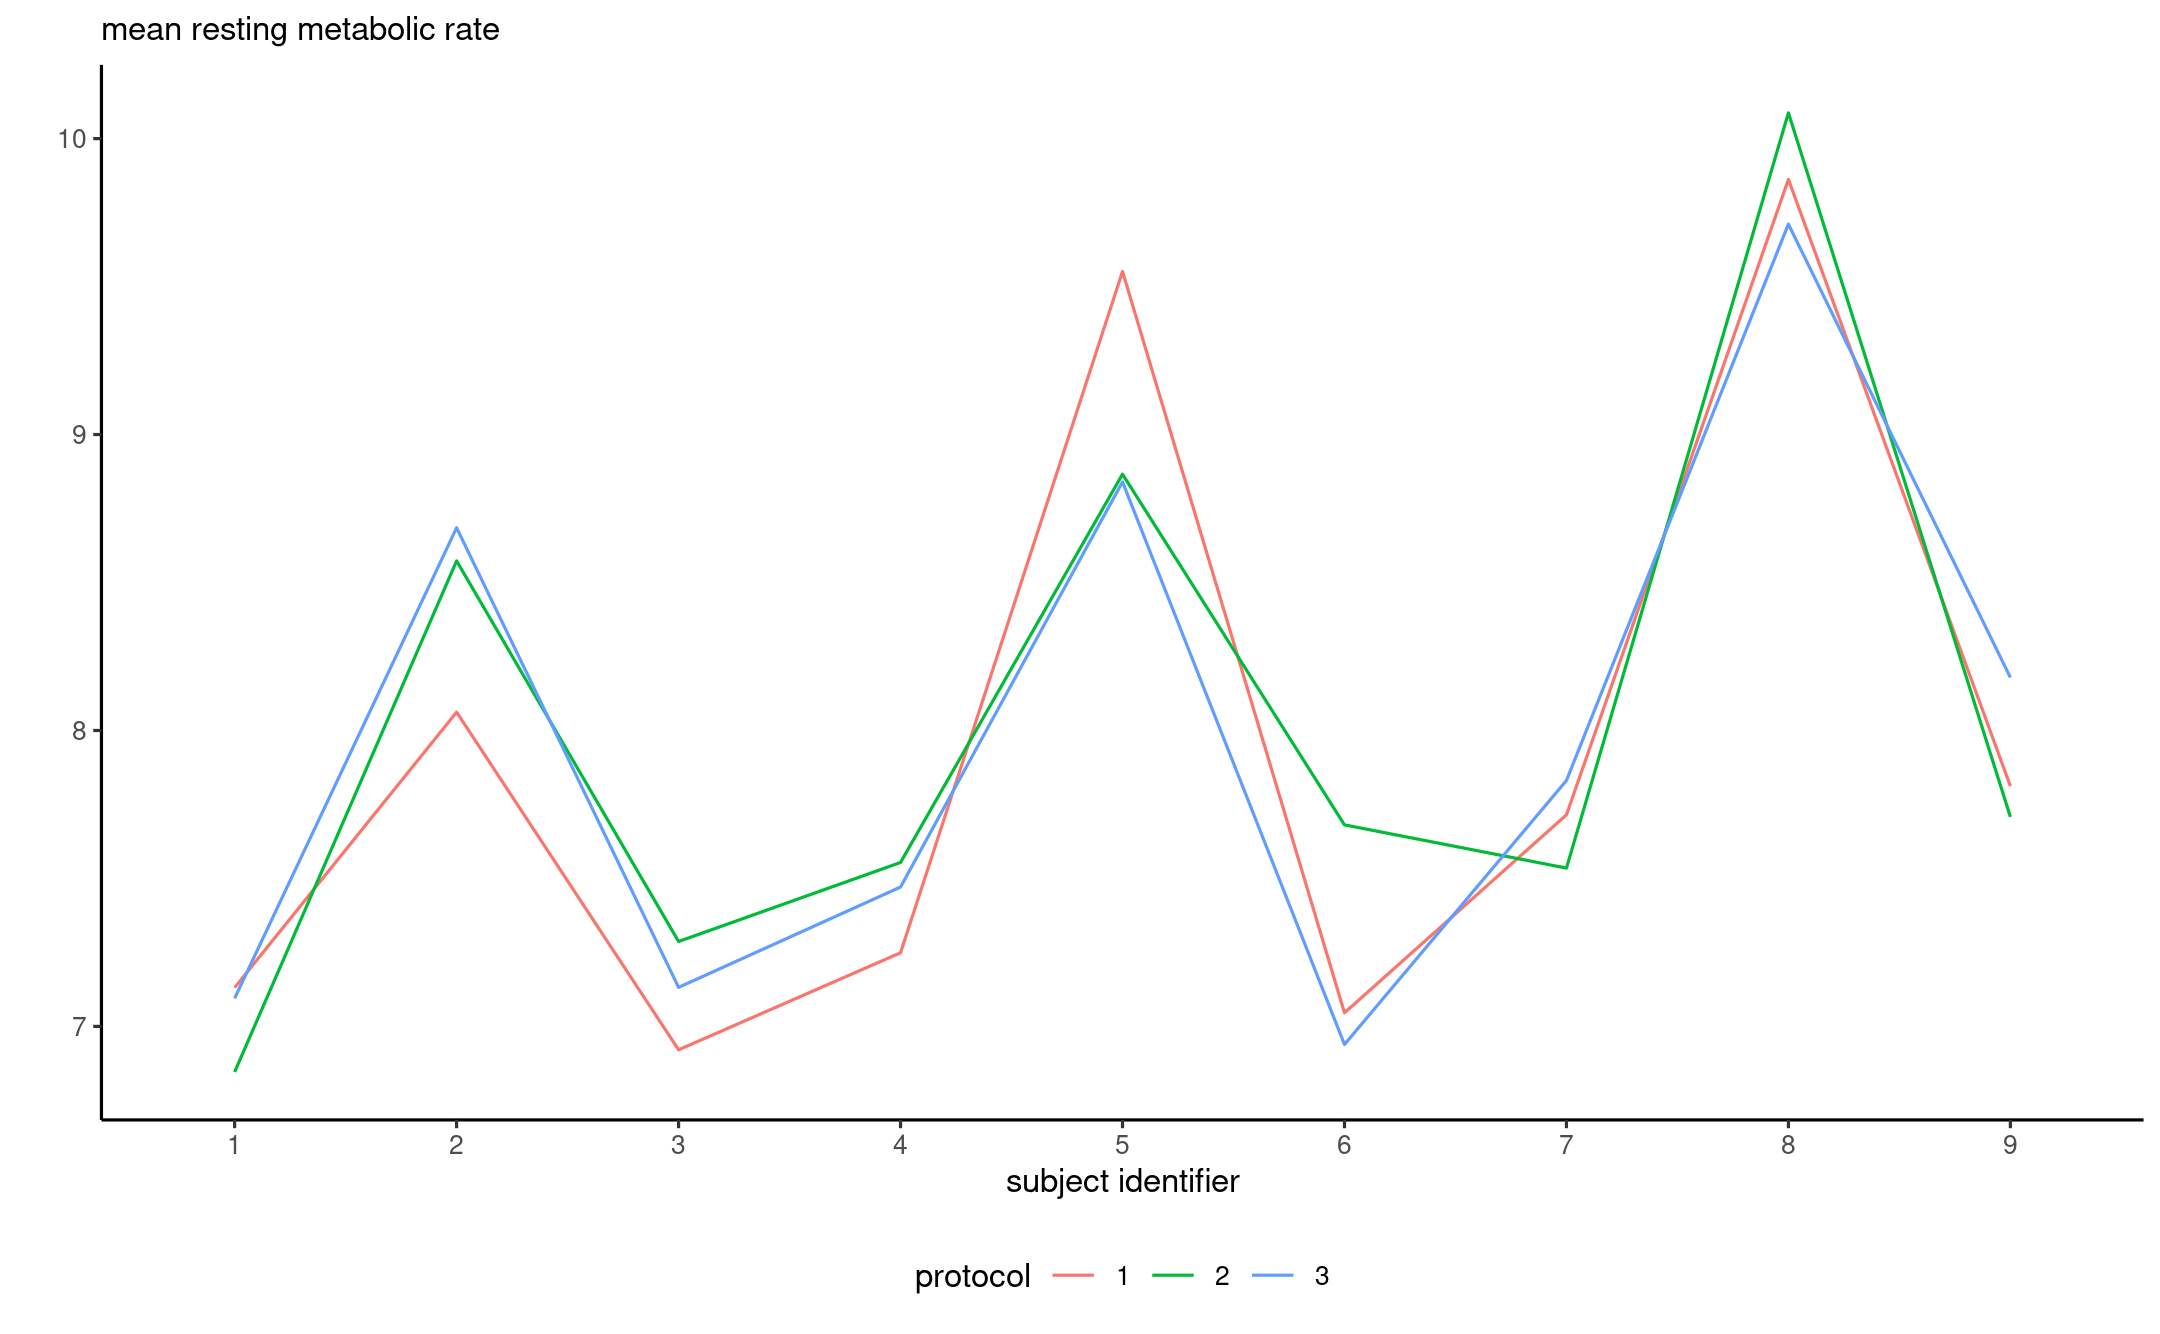
Example: Resting metabolic rate
From Dean, Voss and Draguljić (2017), Example 10.4.1 (p. 311)
experiment that was run to compare the effects of inpatient and outpatient protocols on the in-laboratory measurement of resting metabolic rate (RMR) in humans. A previous study had indicated measurements of RMR on elderly individuals to be 8% higher using an outpatient protocol than with an inpatient protocol. If the measurements depend on the protocol, then comparison of the results of studies conducted by different laboratories using different protocols would be difficult. The experimenters hoped to conclude that the effect on RMR of different protocols was negligible.
The experimental treatments consisted of three protocols: (1) an inpatient protocol in which meals were controlled—the patient was fed the evening meal and spent the night in the laboratory, then RMR was measured in the morning; (2) an outpatient protocol in which meals were controlled—the patient was fed the same evening meal at the laboratory but spent the night at home, then RMR was measured in the morning; and (3) an outpatient protocol in which meals were not strictly controlled—the patient was instructed to fast for 12 hours prior to measurement of RMR in the morning.
Interaction plot

ANOVA table (without blocking)
| Degrees of freedom | Sum of squares | Mean square | F statistic | p-value | |
|---|---|---|---|---|---|
| protocol | 2 | 0.04 | 0.02 | 0.02 | 0.982 |
| Residuals | 24 | 24.35 | 1.01 |
ANOVA table (with blocking)
| Degrees of freedom | Sum of squares | Mean square | F statistic | p-value | |
|---|---|---|---|---|---|
| subject | 8 | 23.12 | 2.89 | 37.42 | 0.000 |
| protocol | 2 | 0.04 | 0.02 | 0.23 | 0.795 |
| Residuals | 16 | 1.24 | 0.08 |
Semipartial effect sizes
If there is a mix of experimental and blocking factors...
Include the variance of all blocking factors and interactions (only with the effect!) in denominator.
- e.g., if A is effect of interest, B is a blocking factor and C is another experimental factor, use η2⟨A⟩=σ2Aσ2A+σ2B+σ2AB+σ2resid.
In R, use effectsize::omega_squared(model, partial = TRUE, generalized = "blocking") where blocking gets replaced with a vector containing the name of the blocking factors.
Random effects and mixed models
Fixed effects
All experiments so far treated factors as fixed effects.
- We estimate a mean parameter for each factor (including blocking factors in repeated measures).
Change of scenery
Change of scenery
Assume that the levels of a factor form a random sample from a large population.
We are interested in making inference about the variability of the factor.
- measures of performance of employees
- results from different labs in an experiment
- subjects in repeated measures
We treat these factors as random effects.
Fixed vs random effects
There is no consensual definition, but Gelman (2005) lists a handful, of which:
When a sample exhausts the population, the corresponding variable is fixed; when the sample is a small (i.e., negligible) part of the population the corresponding variable is random [Green and Tukey (1960)].
Effects are fixed if they are interesting in themselves or random if there is interest in the underlying population (e.g., Searle, Casella and McCulloch [(1992), Section 1.4])
Random effect model
Consider a one-way model
Yijresponse=μglobal mean+αjrandom effect+εijerror term.
where
- αj∼Normal(0,σ2α) is normal with mean zero and variance σ2α.
- εij are independent Normal(0,σ2ε)
Fictional example
Consider the weekly number of hours spent by staff members at HEC since September.
We collect a random sample of 40 employees and ask them to measure the number of hours they work from school (as opposed to remotely) for eight consecutive weeks.
Fitting mixed models in R
We use the lme4 package in R to fit mixed models.
The lmerTest package provides additional functionalities for testing.
lmerfunction fits linear mixed effect regression
Random effects are specified using the notation (1 | factor).
Model fit
library(lmerTest) # also loads lme4rmod <- lmer(time ~ (1 | id), data = hecedsm::workhours)summary_rmod <- summary(rmod)Random effects: Groups Name Variance Std.Dev. id (Intercept) 38.63 6.215 Residual 5.68 2.383 Number of obs: 320, groups: id, 40Fixed effects: Estimate Std. Error df t value Pr(>|t|) (Intercept) 23.3016 0.9917 39.0000 23.5 <2e-16 ***Note that std. dev is square root of variance
Intra-class correlation
We are interested in the variance of the random effect, σ2α.
Measurements from the same individuals are correlated. The intra-class correlation between measurements Yij and Yik from subject i at times j≠k is
ρ=σ2ασ2α+σ2ε.
In the example, ˆσ2α=38.63, ˆσ2ε=5.68 and ˆρ=0.87.
The mean number of working hours on the premises is ˆμ=23.3 hours.
Confidence intervals
We can use confidence intervals for the parameters.
Those are based on profile likelihood methods (asymmetric).
(conf <- confint(rmod, oldNames = FALSE))## 2.5 % 97.5 %## sd_(Intercept)|id 4.978127 7.799018## sigma 2.198813 2.595272## (Intercept) 21.335343 25.267782The variability of the measurements and the week-to-week correlation of employee measures are different from zero.
Shrinkage

Predictions of random effects are shrunk towards global mean, more so for larger values and when there are fewer measurements.
Even with old school, we can get confidence intervals but only in simple designs like this one-way.
Mixed models
Mixed models include both fixed effects and random effects.
- Fixed effects for experimental manipulations
- Random effects for subject, lab factors
Mixed models make it easier to
- handle correlations between measurements and
- account for more complex designs.
Repeated measures ANOVA using mixed model
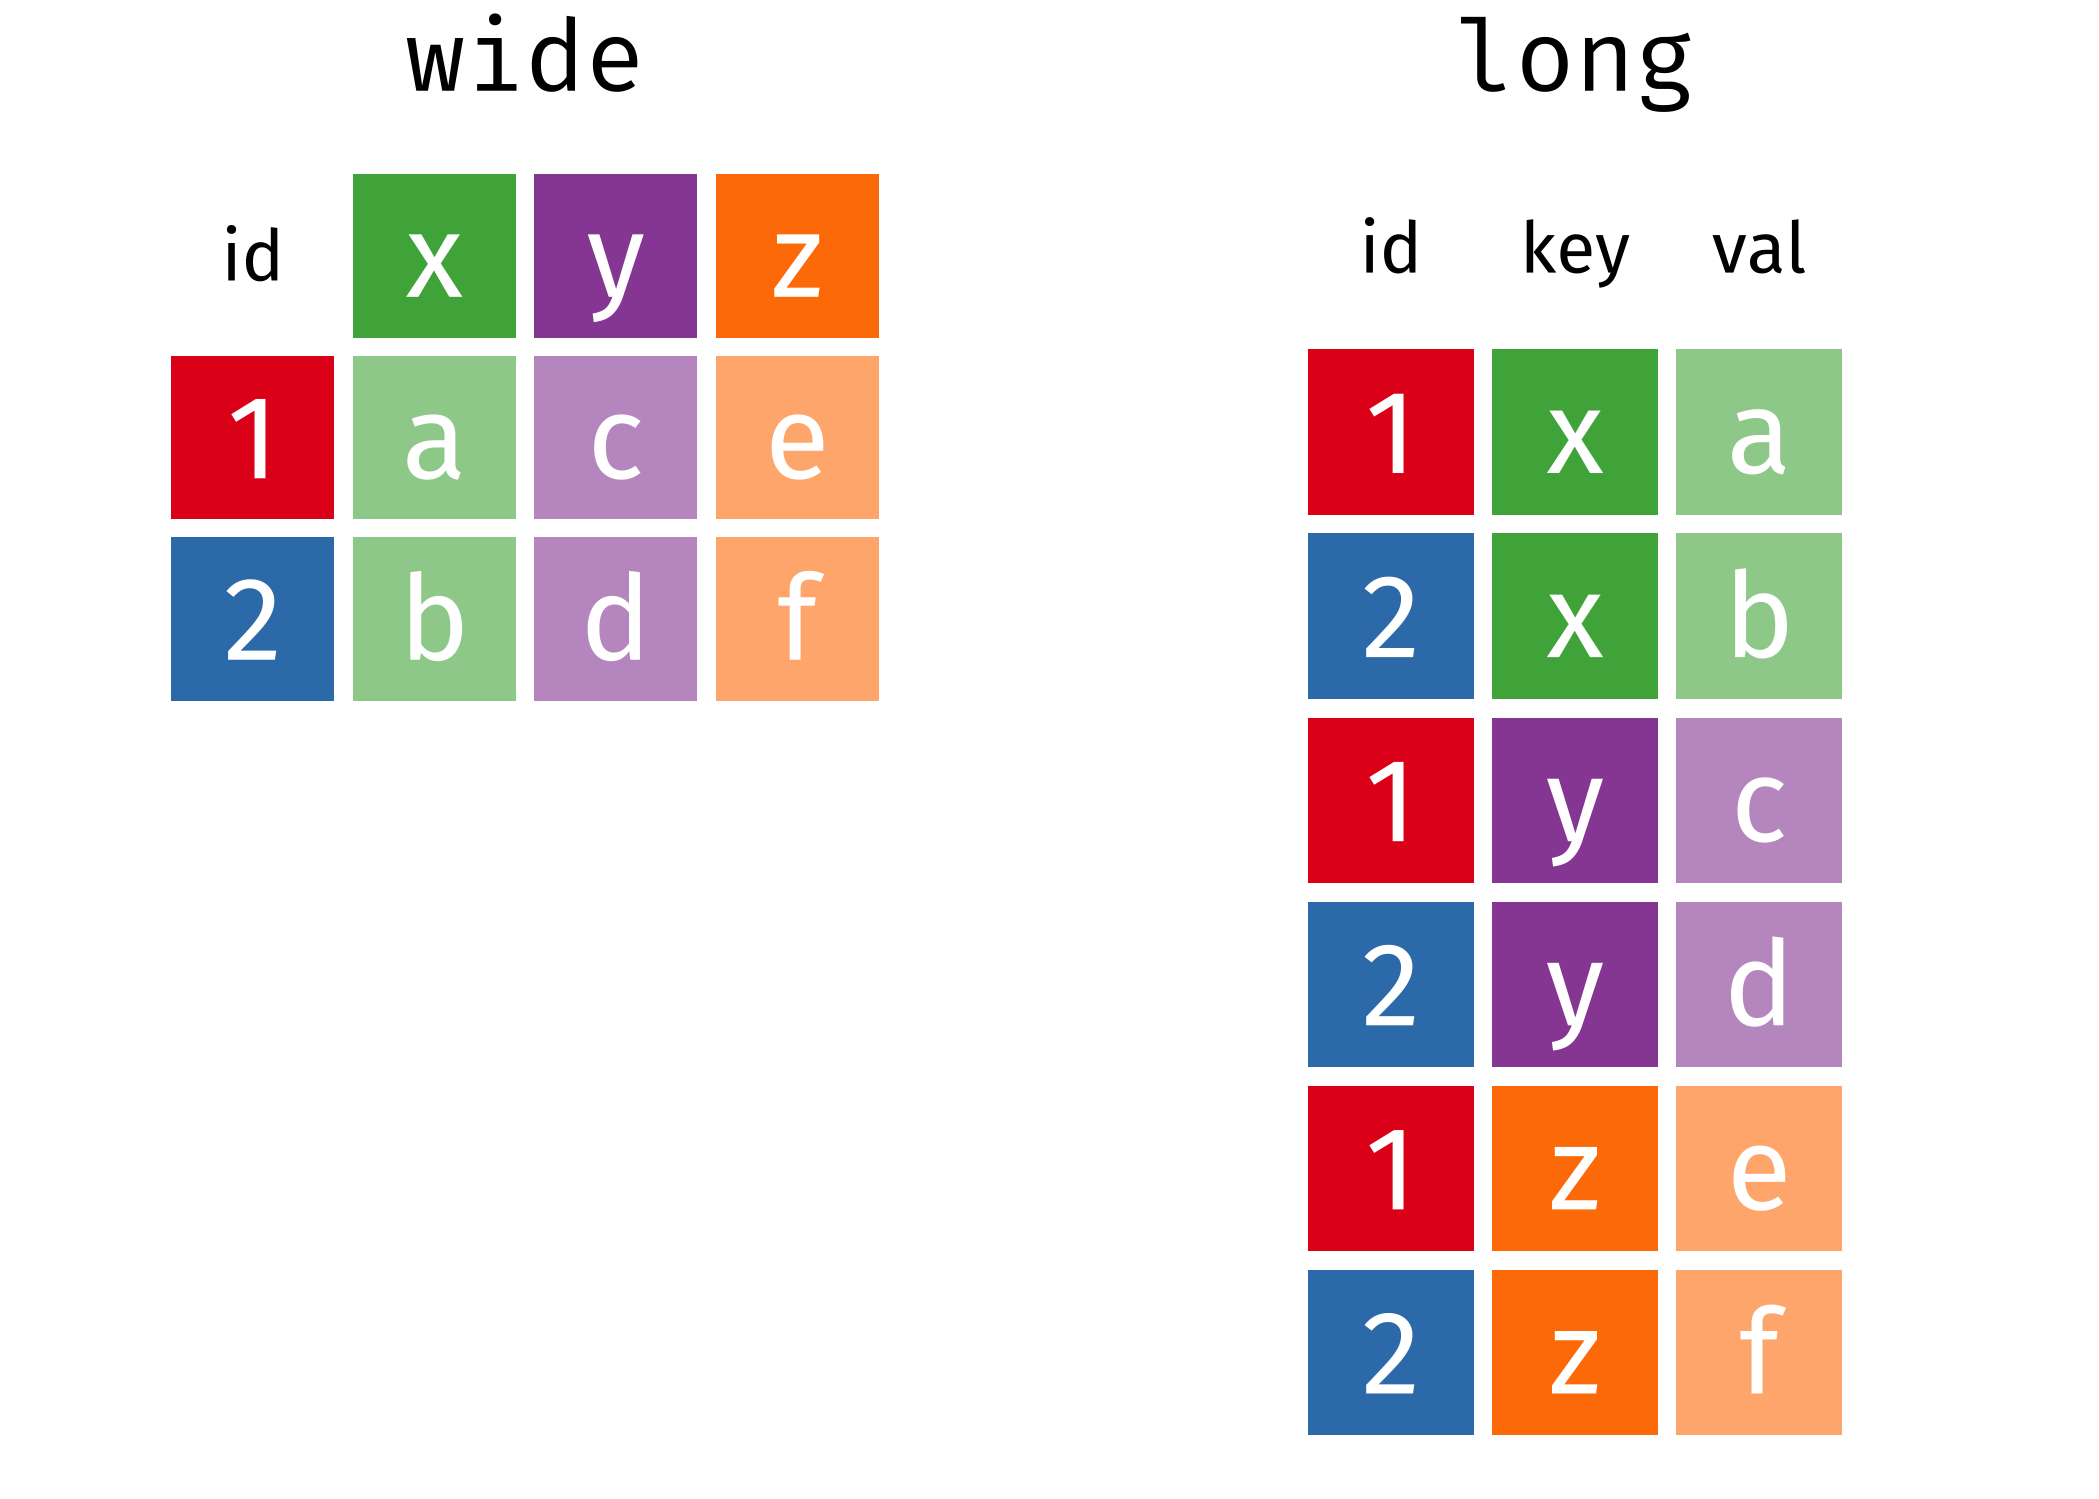
Data need to be in long format, i.e., one response per line with an id column.

Illustration by Garrick Adden-Buie
Example: two-way ANOVA
We consider a repeated measure ANOVA (2 by 2 design, within-between) from Hatano et al. (2022).
data(HOSM22_E3, package = "hecedsm")fmod <- afex::aov_ez( id = "id", dv = "imscore", between = "waiting", within = "ratingtype", data = HOSM22_E3)anova(fmod)## Anova Table (Type 3 tests)## ## Response: imscore## num Df den Df MSE F ges Pr(>F) ## waiting 1 61 2.48926 11.2551 0.126246 0.00137 ** ## ratingtype 1 61 0.68953 38.4330 0.120236 5.388e-08 ***## waiting:ratingtype 1 61 0.68953 0.0819 0.000291 0.77575 ## ---## Signif. codes: 0 '***' 0.001 '**' 0.01 '*' 0.05 '.' 0.1 ' ' 1Repeated measures with linear mixed models
Results are the same as for repeated measures ANOVA if the correlation estimate between observations of the same id are nonnegative.
mixmod <- lmerTest::lmer( imscore ~ waiting*ratingtype + (1 | id), # random intercept per id data = HOSM22_E3)anova(mixmod, type = 3)## Type III Analysis of Variance Table with Satterthwaite's method## Sum Sq Mean Sq NumDF DenDF F value Pr(>F) ## waiting 7.7608 7.7608 1 61 11.2551 0.00137 ** ## ratingtype 26.5009 26.5009 1 61 38.4330 5.388e-08 ***## waiting:ratingtype 0.0565 0.0565 1 61 0.0819 0.77575 ## ---## Signif. codes: 0 '***' 0.001 '**' 0.01 '*' 0.05 '.' 0.1 ' ' 1Theory
Full coverage of linear mixed models and general designs is beyond the scope of the course, but note
- Estimation is performed via restricted maximum likelihood (REML)
- Testing results may differ from repeated measure ANOVA
- Different approximations for F degrees of freedom, either
- Kenward–Roger (costly) or
- Satterthwaite's approximation
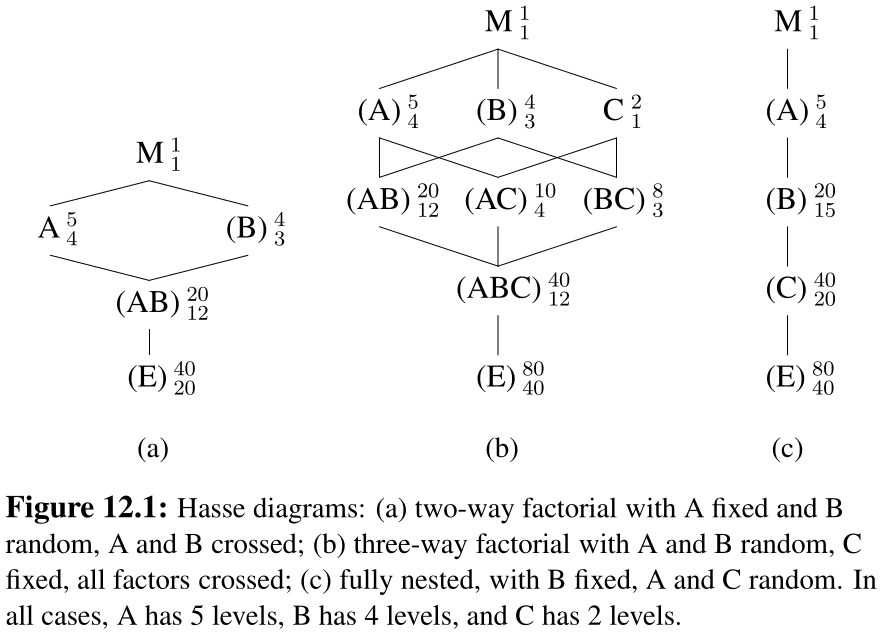
Structure of the design
It is important to understand how data were gathered.
Oelhert (2010) guidelines
- Identify sources of variation
- Identify whether factors are crossed or nested
- Determine whether factors should be fixed or random
- Figure out which interactions can exist and whether they can be fitted.
Crossed vs nested effects
Nested effects if a factor appears only within a particular level of another factor.
Crossed is for everything else (typically combinations of factors are possible).

Example of nested random effects: class nested within schools
- class 1 is not the same in school 1 than in school 2

Matroschka from Wikimedia Commons CC-BY-SA 3.0 https://en.wikipedia.org/wiki/Matryoshka_doll#/media/File:Matryoshka_transparent.png
Specifying interactions
Consider factors A, B and C.
- If factor A is treated as random, interactions with A must be random too.
- There must be repeated measurements to estimate variability of those interactions.
- Testing relies on the variance components.
Mixed models vs repeated measures
- In repeated measure ANOVA, repetitions over each sub-condition are averaged across subject.
- Treat subject identifier as a blocking factor (fixed effect).
- Impose sum-to-zero for coefficients.
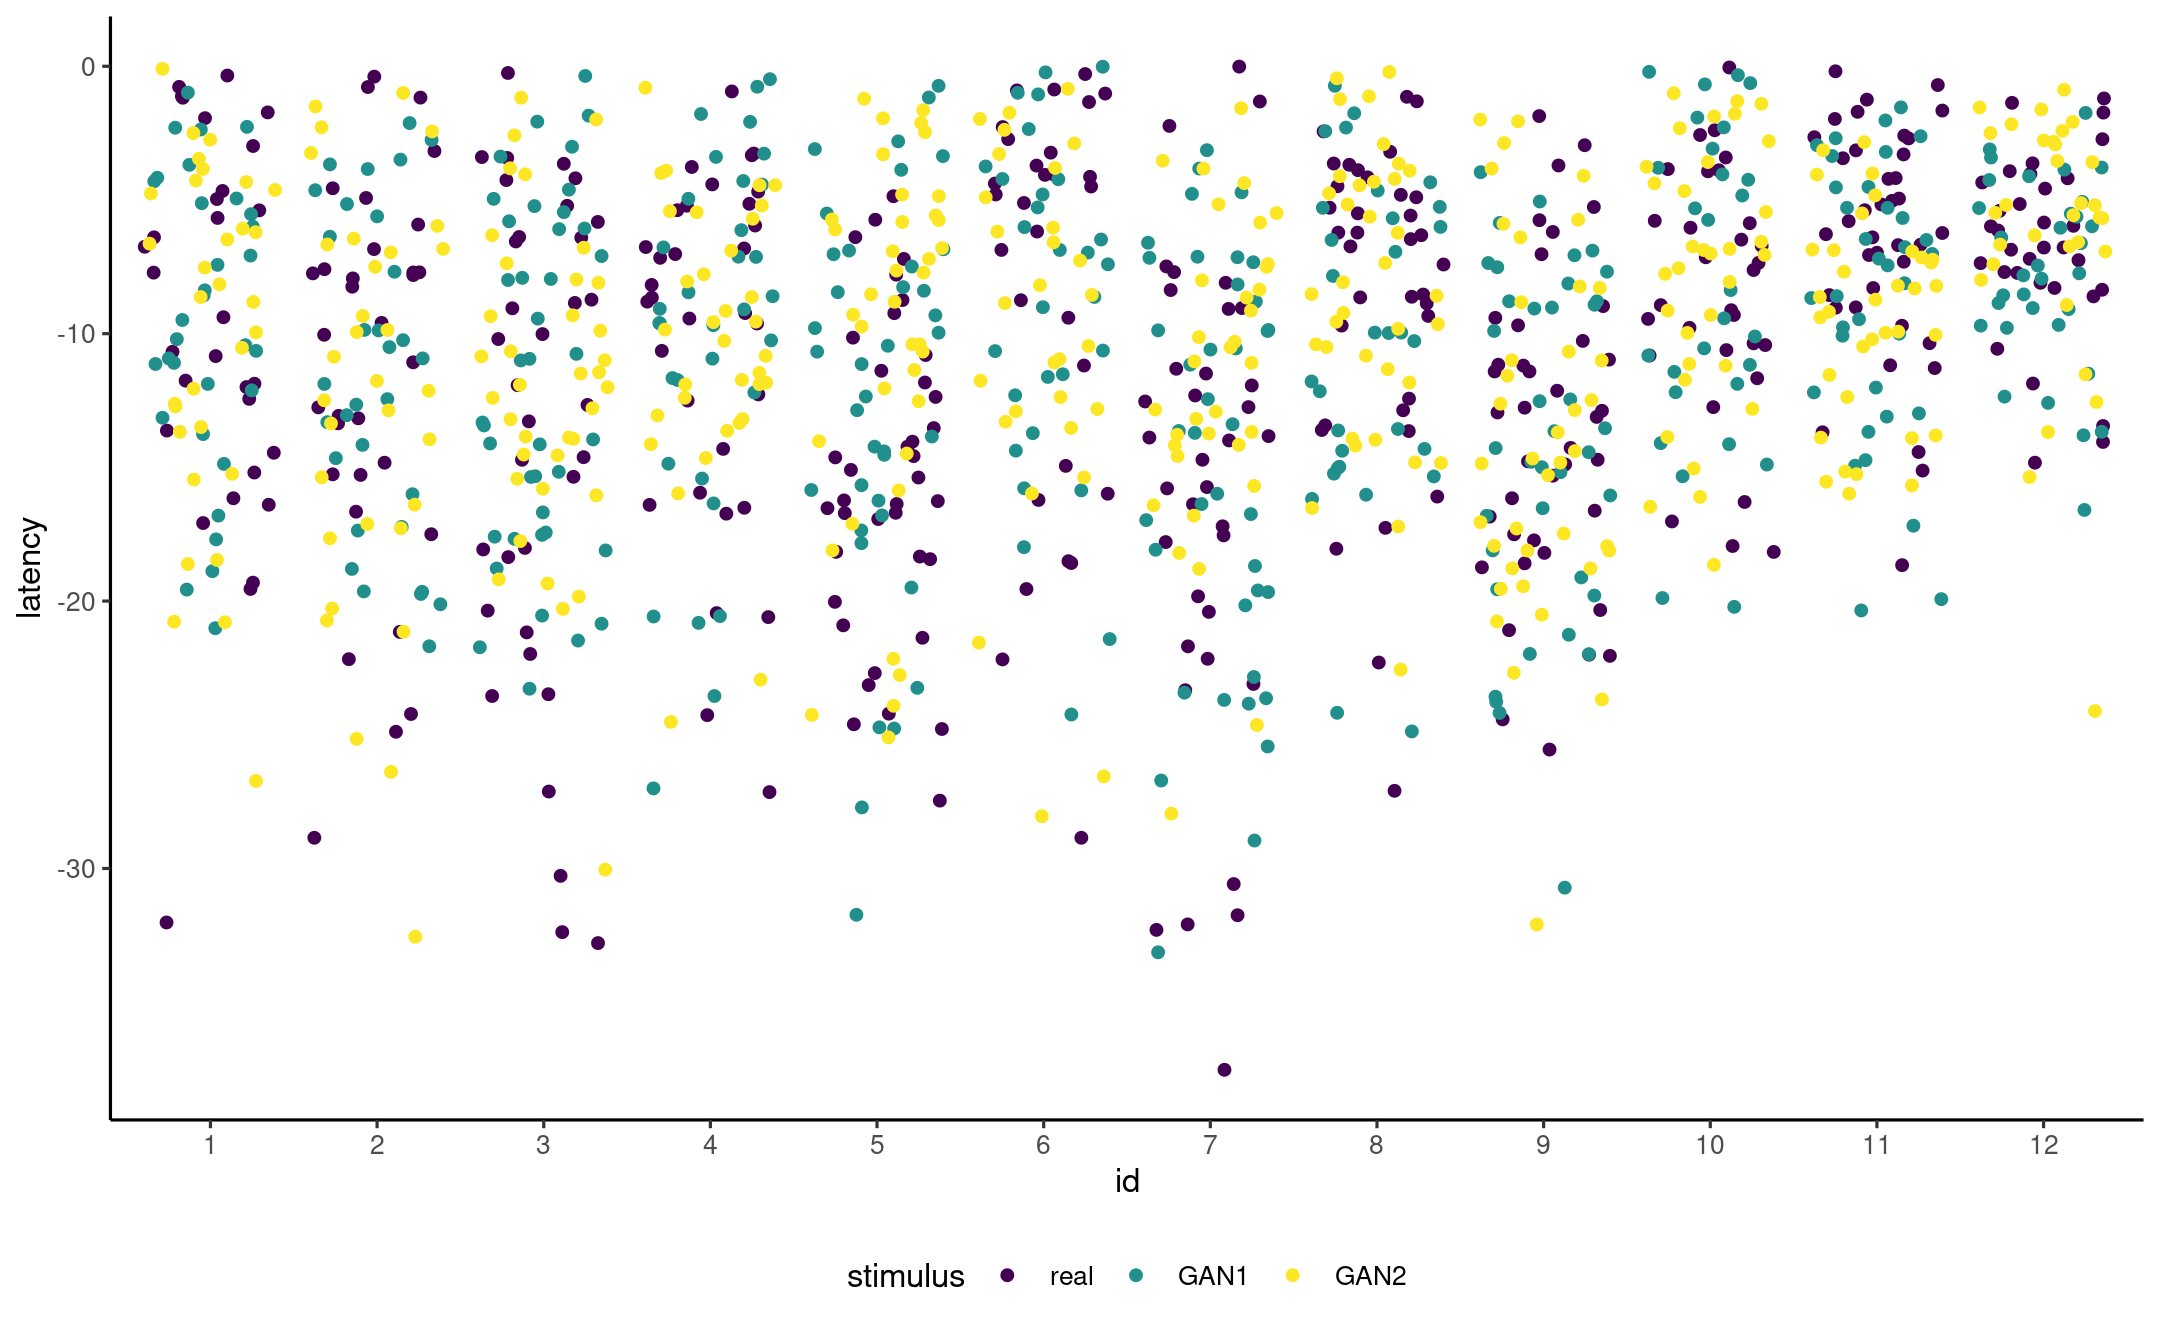
Example: happy fakes

Jittered scatterplot of measurements per participant and stimulus type.
Interaction with random and fixed effect
Add student id as random effect, stimulus as fixed effect and their interaction as random effect (since one parent is random)
data(AA21, package = "hecedsm")anova(ddf = "Kenward-Roger", # other option is "Satterthwaite" lmerTest::lmer( data = AA21 |> dplyr::filter(latency > -40), latency ~ stimulus + (1 | id) + (1 | id:stimulus)))## Type III Analysis of Variance Table with Kenward-Roger's method## Sum Sq Mean Sq NumDF DenDF F value Pr(>F)## stimulus 65.573 32.786 2 21.878 0.8465 0.4425# Approximately 22 degrees of freedom (as for repeated measures)Data structure

Example: chocolate rating
Example from L. Meier, adapted from Oehlert (2010)
A group of 10 rural and 10 urban raters rated 4 different chocolate types. Every rater got to eat two samples from the same chocolate type in random order.
Example: Curley et al. (2022)
Two variables were manipulated within participants: (a) evidence anchor (strong-first versus weak-first); (b) verdict system (two- versus three-verdict systems). Total pre-trial bias score was used as a covariate in the analysis (this score is based on the PJAQ and is explained further in the Materials section). Participants were also given two vignettes (Vignette 1 and Vignette 2); thus, the vignette variable was included in the data analysis [...]
The dependent variable was the final belief of guilt score, which was measured on an accumulated scale from 0–14, with 0 representing no belief of guilt and 14 representing a total belief that the person is guilty
This study is an instance of incomplete design.