Introduction to causal inference
Session 11
MATH 80667A: Experimental Design and Statistical Methods
HEC Montréal
Outline
Outline
Basics of causal inference
Outline
Basics of causal inferenceDirected acyclic graphs
Outline
Basics of causal inferenceDirected acyclic graphs Causal mediation
Causal inference
Correlation is not causation
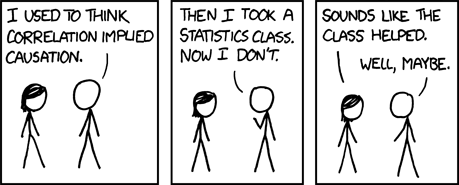
xkcd comic 552 by Randall Munroe, CC BY-NC 2.5 license. Alt text: Correlation doesn't imply causation, but it does waggle its eyebrows suggestively and gesture furtively while mouthing 'look over there'.
Spurious correlation
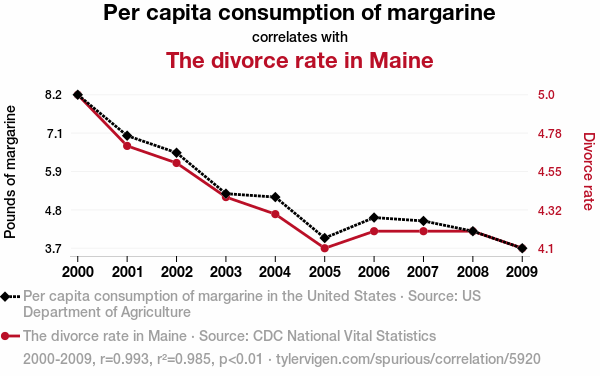
Spurious correlation by Tyler Vigen, licensed under CC BY 4.0
Correlation vs causation
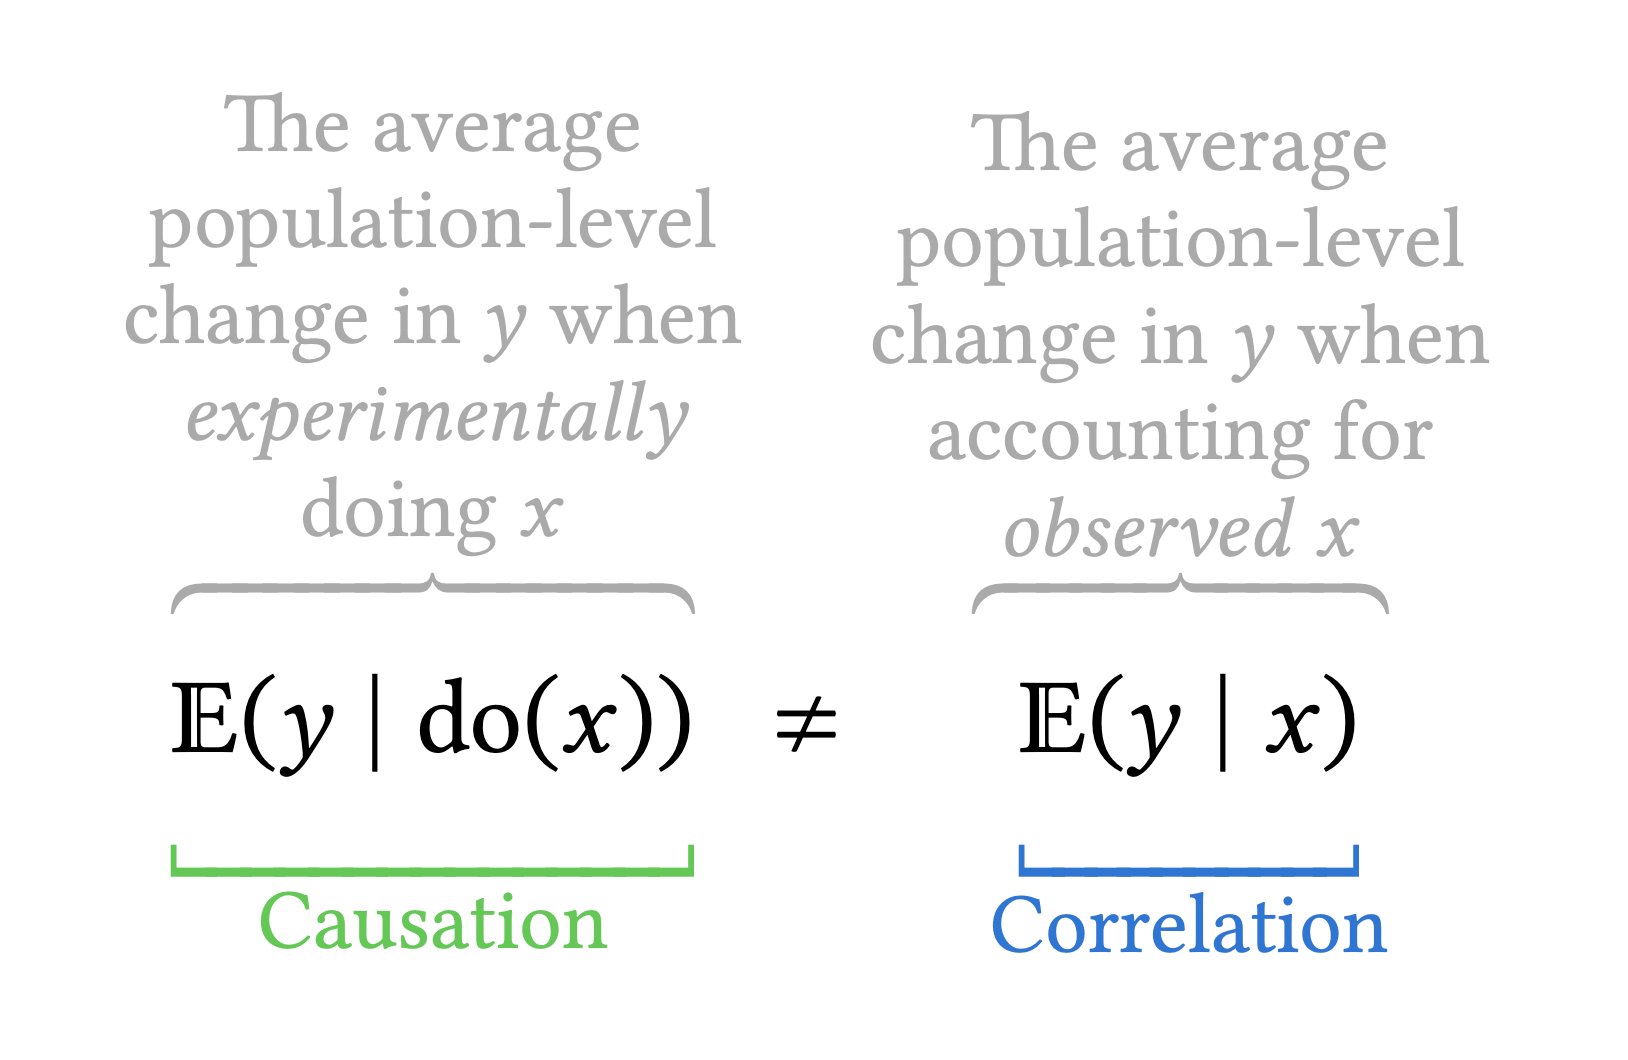
Illustration by Andrew Heiss, licensed under CC BY 4.0
Potential outcomes
For individual i, we postulate the existence of a potential outcomes
- Yi(1) (response for treatment X=1) and
- Yi(0) (response for control X=0).
Both are possible, but only one will be realized.
Observe outcome for a single treatment
- Result Y(X) of your test given that you either party (X=1) or study (X=0) the night before your exam.
Fundamental problem of causal inference
With binary treatment Xi, I observe either Yi∣do(Xi=1) or Yi∣do(Xi=0).
| i | Xi | Yi(0) | Yi(1) | Yi(1)−Yi(0) |
|---|---|---|---|---|
| 1 | 1 | ? | 4 | ? |
| 2 | 0 | 3 | ? | ? |
| 3 | 1 | ? | 6 | ? |
| 4 | 0 | 1 | ? | ? |
| 5 | 0 | 5 | ? | ? |
| 6 | 1 | ? | 7 | ? |
Causal assumptions?
Since we can't estimate individual treatment, we consider the average treatment effect (average over population) E{Y(1)−Y(0)}.
The latter can be estimated as
ATE=E(Y∣X=1)expected response amongtreatment group−E(Y∣X=0)expected response amongcontrol group
When is this a valid causal effect?
(Untestable) assumptions
For the ATE to be equivalent to E{Y(1)−Y(0)}, the following are sufficient:
- ignorability, which states that potential outcomes are independent of assignment to treatment
- lack of interference: the outcome of any participant is unaffected by the treatment assignment of other participants.
- consistency: given a treatment X taking level j, the observed value for the response Y∣X=j is equal to the corresponding potential outcome Y(j).
Directed acyclic graphs
Slides by Dr. Andrew Heiss, CC BY-NC 4.0 License.
Types of data
Experimental
You have control over which units get treatment
Types of data
Experimental
You have control over which units get treatment
Observational
You don't have control over which units get treatment
Causal diagrams
Directed acyclic graphs (DAGs)
Directed: Each node has an arrow that points to another node
Acyclic: You can't cycle back to a node (and arrows only have one direction)
Graph: A set of nodes (variables) and vertices (arrows indicating interdependence)
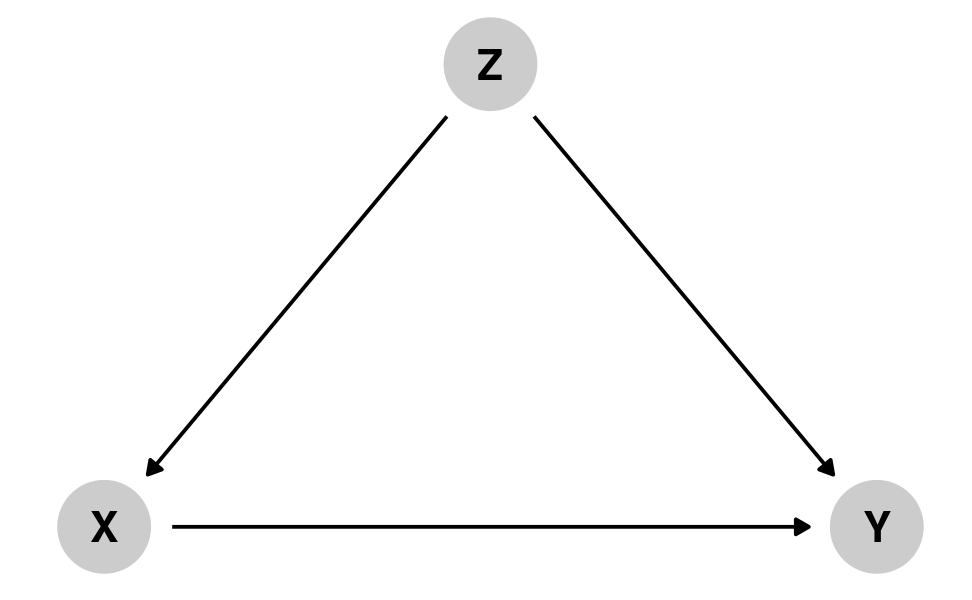
Causal diagrams
Directed acyclic graphs (DAGs)
Graphical model of the process that generates the data
Maps your logical model

Three types of associations
Confounding
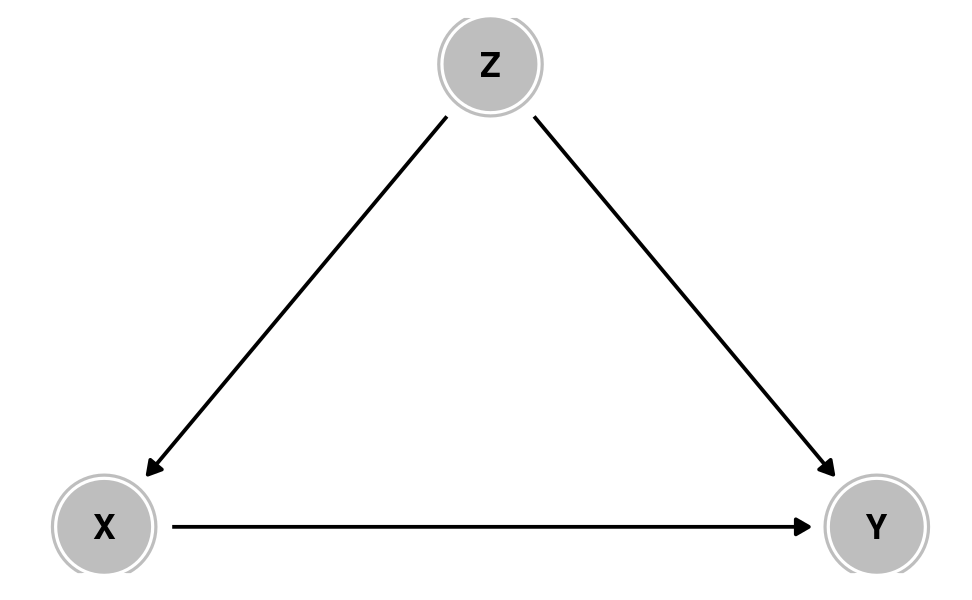
Common cause
Causation
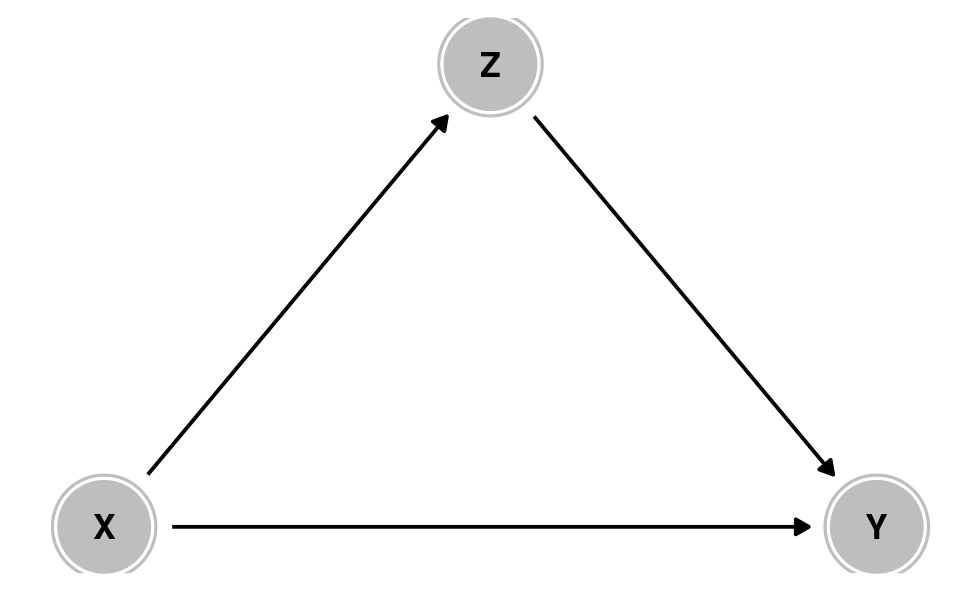
Mediation
Collision
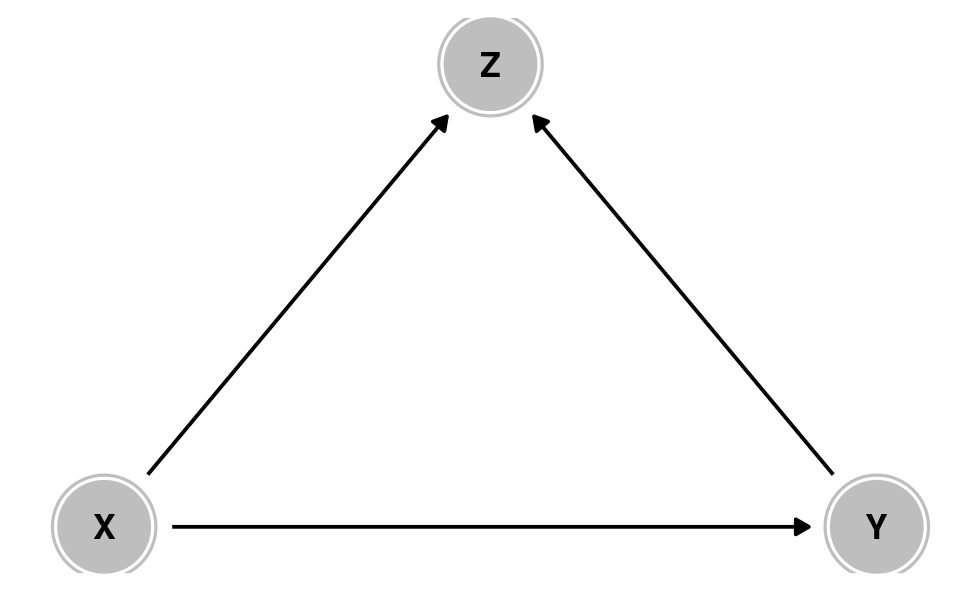
Selection /
endogeneity
Confounding
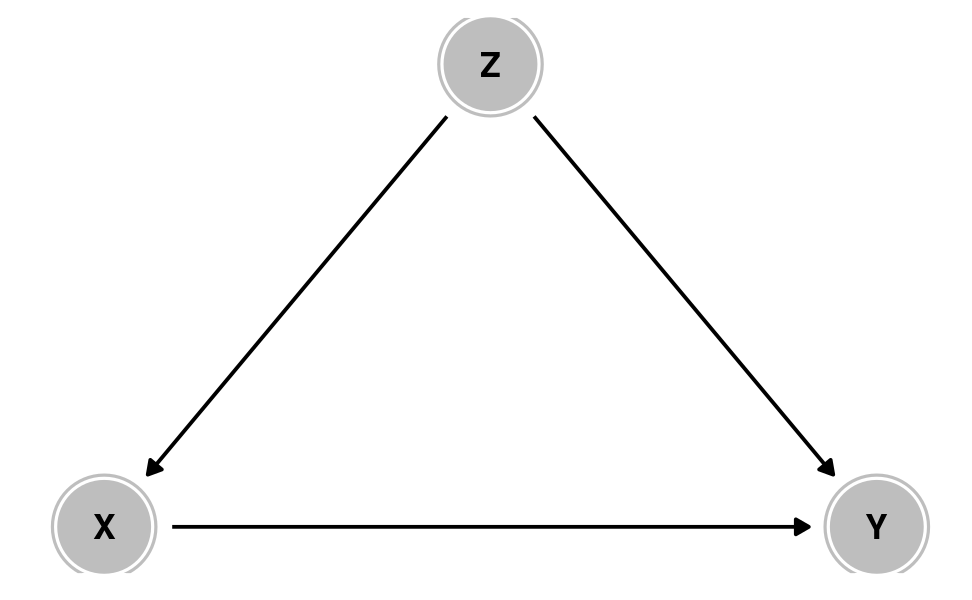
X causes Y
But Z causes both X and Y
Z confounds the X → Y association
Confounder: effect of money on elections
What are the paths
between money and win margin?
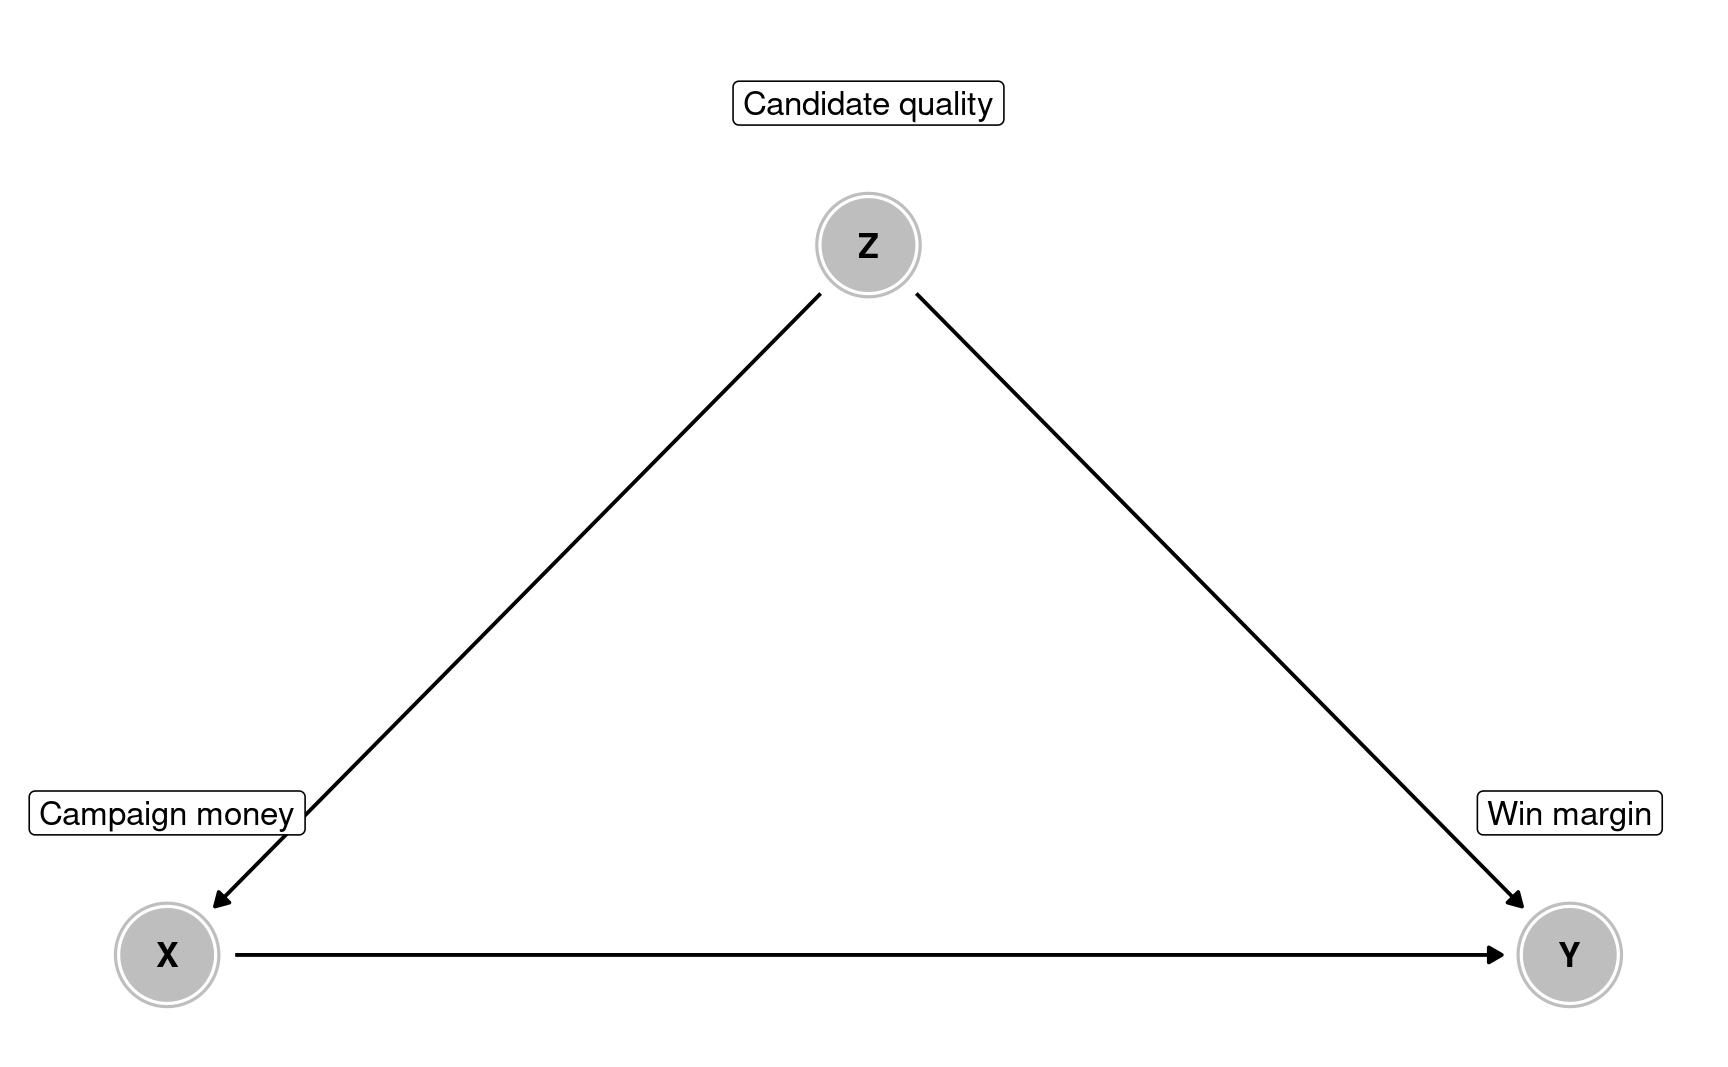
Money → Margin
Money ← Quality → Margin
Quality is a confounder
Experimental data
Since we randomize assignment to treatment X, all arrows incoming in X are removed.
With observational data, we need to explicitly model the relationship and strip out the effect of X on Y.
How to adjust with observational data
- Include covariate in regression
- Matching: pair observations that are more alike in each group, and compute difference between these
- Stratification: estimate effects separately for subpopulation (e.g., young and old, if age is a confounder)
- Inverse probability weighting: estimate probability of self-selection in treatment group, and reweight outcome.
Causation
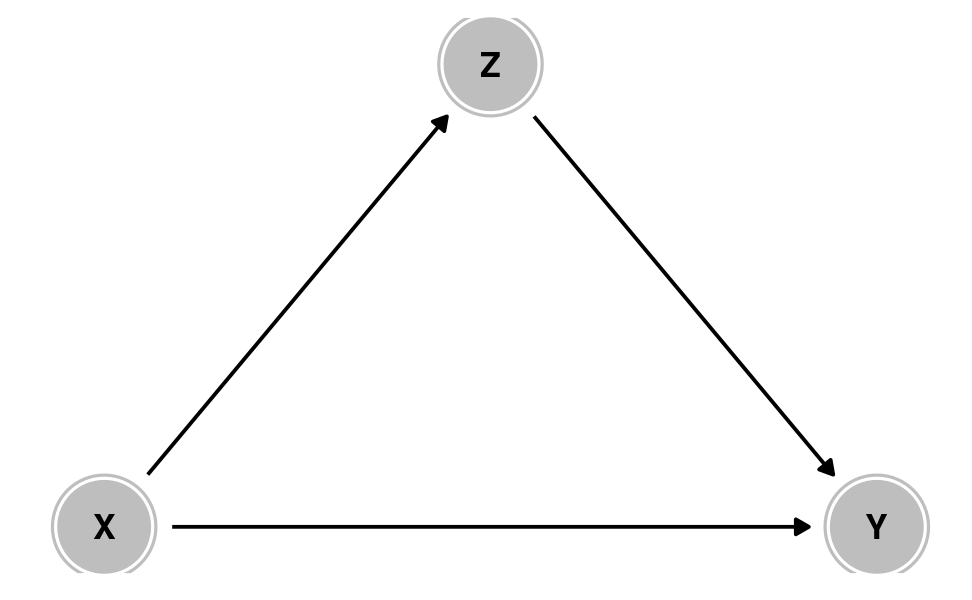
X causes Y
X causes
Z which causes Y
Z is a mediator
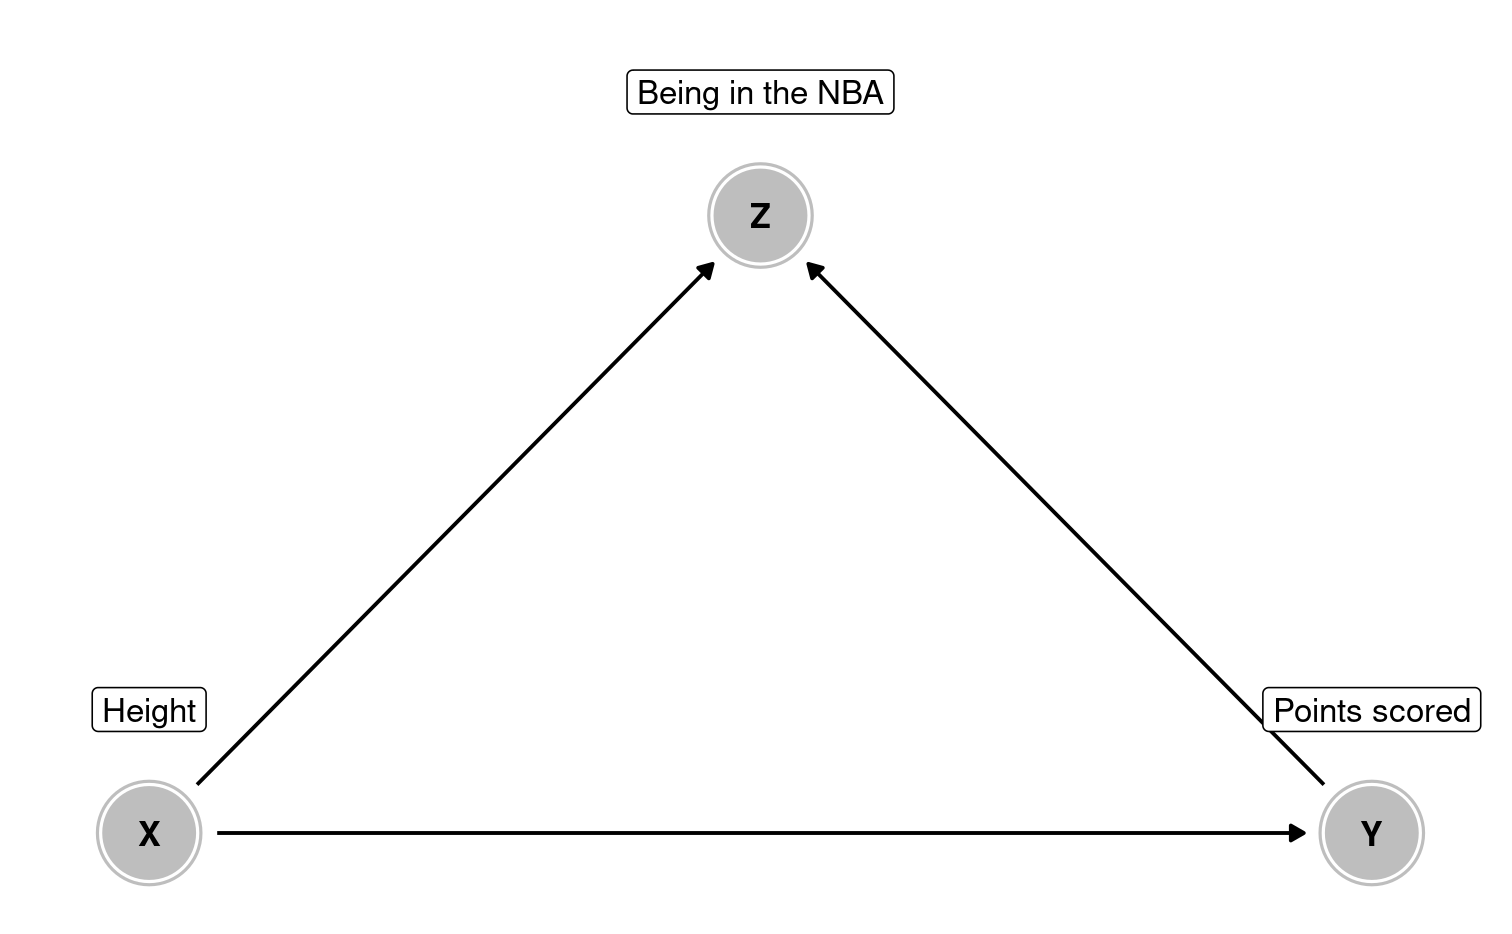
Colliders
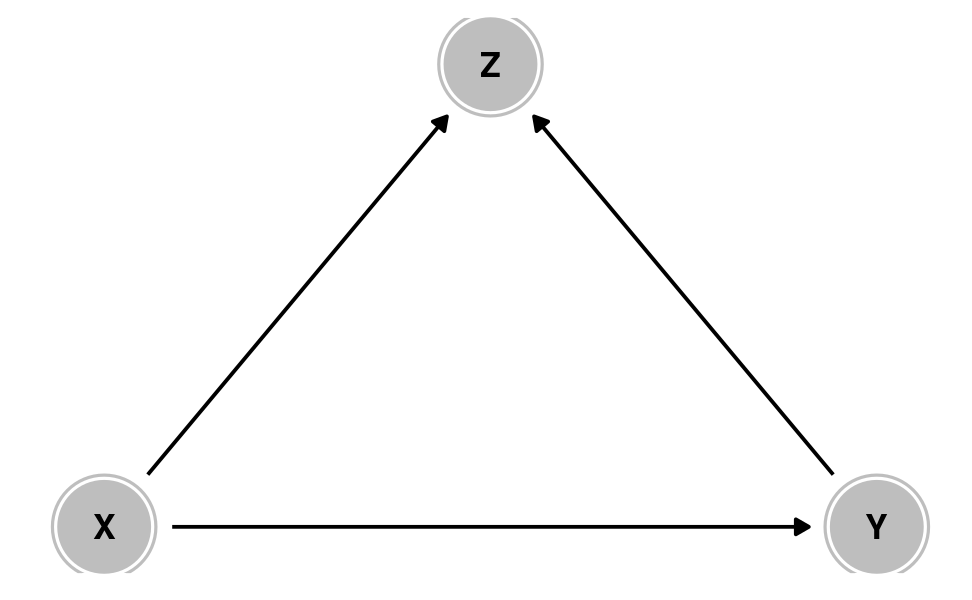
X causes Z
Y causes Z
Should you control for Z?
Colliders can create
fake causal effects
Colliders can hide
real causal effects
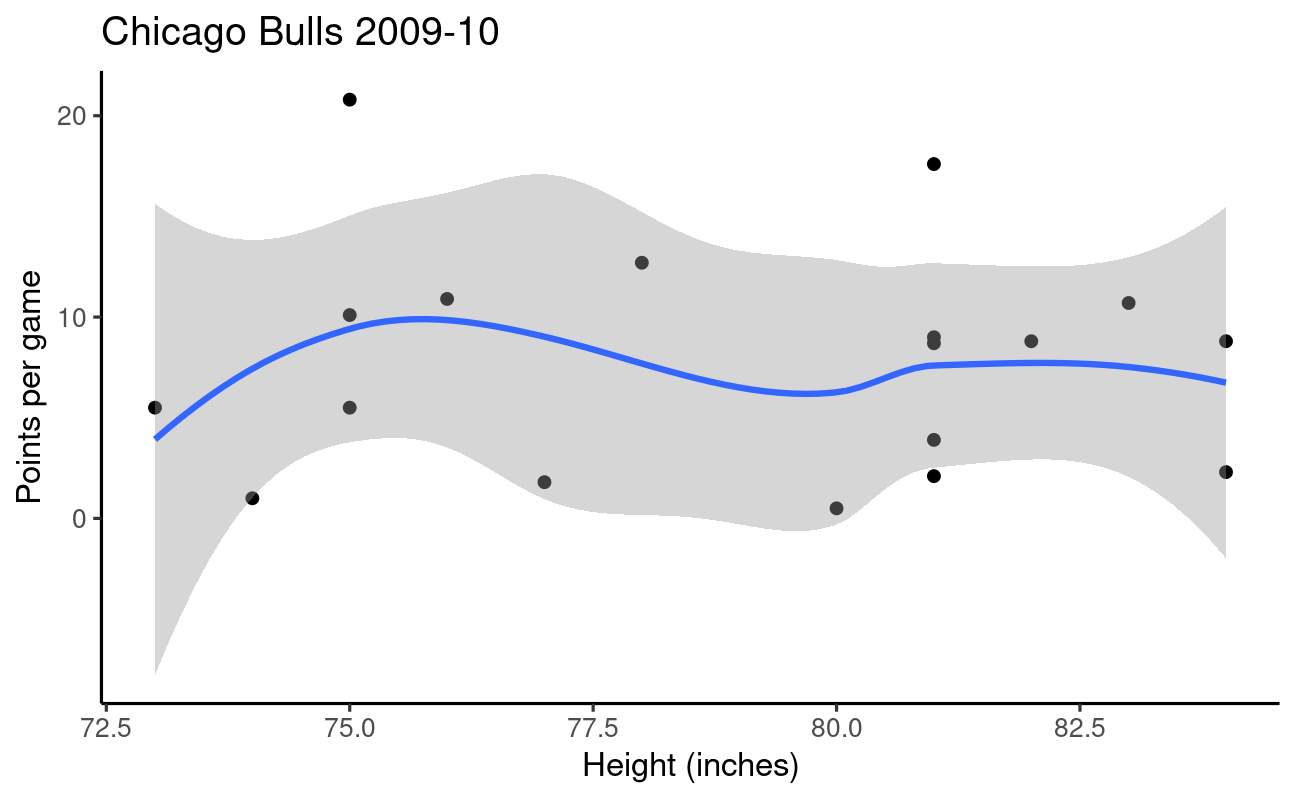
Height is unrelated to basketball skill… among NBA players
Colliders and selection bias
A new collider bias teaching example. Sample selects on marriage (not divorced) so: satisfaction ––> [not divorced] <–– children (Richard McElreath, Apr 26, 2021 on Twitter)
Example of confounder: https://doi.org/10.1177/109467051454314
Three types of associations
Confounding
 Common cause
Causal forks X ← Z → Y
Causation
 Mediation
Causal chain X → Z → Y
Collision
 Selection /
endogeneity
inverted fork X → Z ← Y
Life is inherently complex
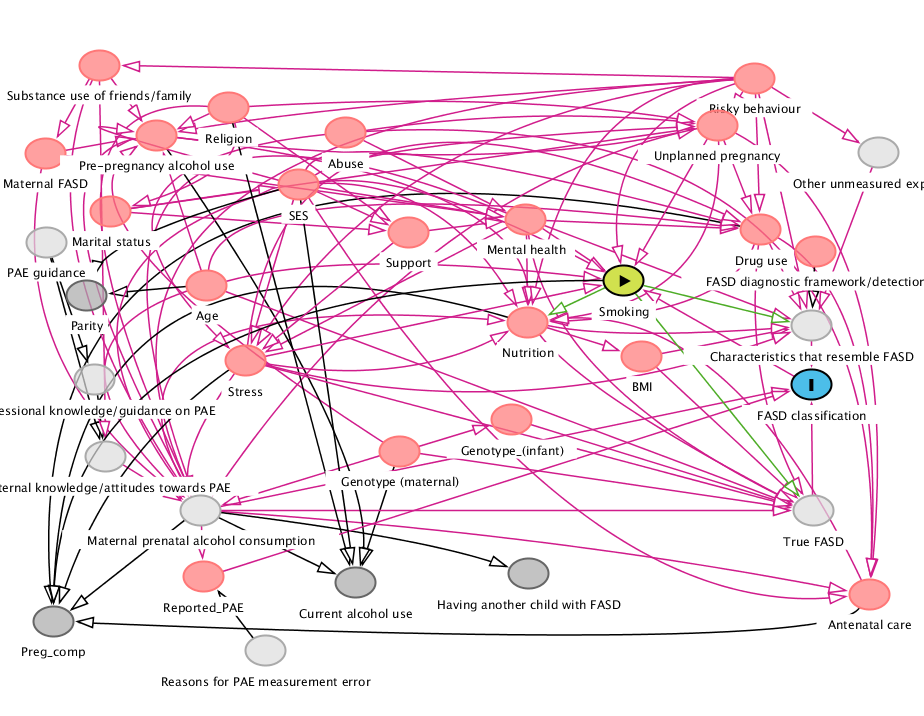
Postulated DAG for the effect of smoking on fetal alcohol spectrum disorders (FASD)
Source: Andrew Heiss (?), likely from
McQuire, C., Daniel, R., Hurt, L. et al. The causal web of foetal alcohol spectrum disorders: a review and causal diagram. Eur Child Adolesc Psychiatry 29, 575–594 (2020). https://doi.org/10.1007/s00787-018-1264-3