Linear mediation
Session 12
MATH 80667A: Experimental Design and Statistical Methods
HEC Montréal
Linear mediation
Reminder: three types of causal associations
Confounding Common cause Causal forks X ← Z → Y
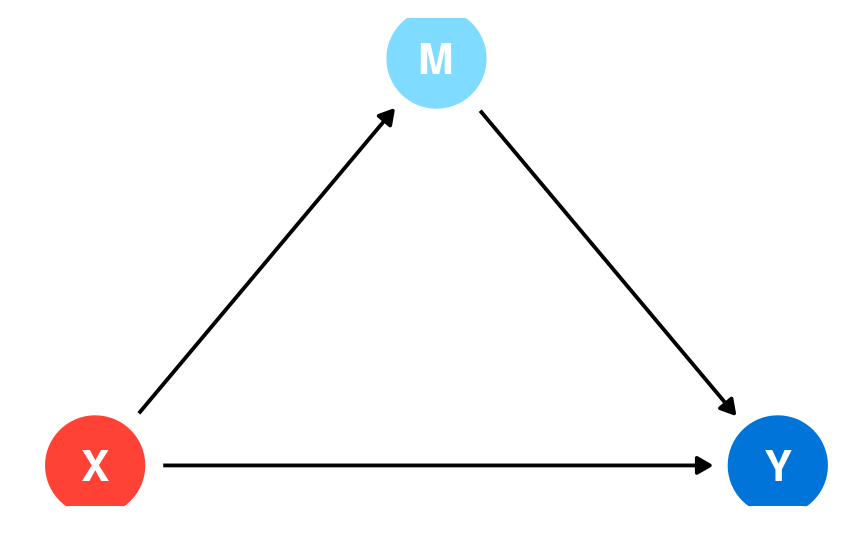
Causation Mediation Causal chain X → Z → Y
Collision
Selection /
endogeneity
inverted fork X → Z ← Y

Notation
Define
- treatment of individual i as Xi, typically binary or categorical with Xi∈{0,…,K} and
- X=0 (control)
- X=k (treatment) for k=1,…,K
- potential mediation given treatment x as Mi(x) and
- potential outcome for treatment x and mediator m as Yi(x,m).
Sequential ignorability assumption
- Given pre-treatment covariates Z, potential outcomes for mediation and treatment are conditionally independent of treatment assignment. Yi(x′,m),Mi(x) ⊥⊥ Xi∣Zi=z
- Given pre-treatment covariates Z and observed treatment x, potential outcomes for the response are independent of mediation. Yi(x′,m) ⊥⊥ Mi(x)∣Xi=x,Zi=z
- Assumption 1 holds under randomization of treatment.
- Assumption 2 implies there is no confounder affecting both Yi,Mi.
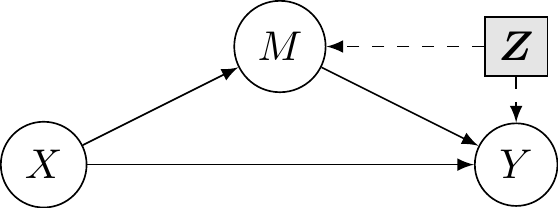
Directed acyclic graph

Directed acyclic graph of the linear mediation model
Z are potential confounders. If we randomly allocate X (experiment), then all incoming arrows vanish and we have no confounder for X vs M or X vs Y.
Average directed effect
The ADE measures the flow along X→Y, disabling the pathway X→M→Y by fixing the mediator value: it is ADE(x)=E[Yi(1,Mi(x))−Yi(0,Mi(x))}
This measures the expected change in response when the experimental factor changes from treatment to control, while the mediator is set to a fixed value Mi(x) uniformly over the population. Fixing the mediator may or not be feasible experimentally.
If there is no interaction between the treatment and the mediator, then ADE(0)=ADE(1).
Average causal mediation effect
Also called indirect effect, obtained for a fixed intervention due to changing the values of the mediator to those it would take under the treatment and control group, respectively Mi(1) and Mi(0).
ACME(x)=E[Yi{x,Mi(1)}−Yi{x,Mi(0)}]
If there is no interaction between the treatment and the mediator, then ACME(0)=ACME(1)
Total effect
Total effect: overall impact of X (both through M and directly)
TE=E[Y∣do(X=1)]−E[Y∣do(X=0)]
X → M → Y
plus
X → Y

The total effect is the average change in response if we randomize treatment assignment and consider the difference treatment vs control.
Total effect
The total effect measures the average overall impact of changes in outcome Y (both through M and directly) when experimentally manipulating X, TE=E[Yi{1,M(1)}]−E[Yi{0,M(0)}],
- The total effect is obtained as TE=ACME(X)+ADE(1−X),X=0,1.
The values of the average causal mediation effect and the average direct effect are the same regardless of the treatment assignment x if there is no interaction.
Linear mediation model
Consider the following two linear regression models with a binary treatment X∈{0,1} and M binary or continuous:
Mβdmediator=cmβdintercept+αX+εmβerror termYβdresponse=cyβintercept+βXdirect effect+γM+εyβerror term
We assume that zero-mean error terms εm and εy are uncorrelated.
- This is tied to the no confounders assumption.
Total effect decomposition
Plugging the first equation in the second, we get the marginal model for Y given treatment X E(Y∣X=x)=(cy+γcm)intercept+(β+αγ)total effect⋅x
In an experiment, we can obtain the total effect via the ANOVA model, with
Y=νaverage of control+τXtotal effect+εY′error termτ=E{Y∣do(X=1)}−E{Y∣do(X=0)}
Product of coefficient method
In the linear mediation model of Baron and Kenny, the quantities of interest are
ACME(x)=E[Y{x,M(1)}−Y{x,M(0)}]=αγADE(x)=E[Y{1,M(x)}−Y{0,M(x)}]=βTE=E[Y{1,M(1)}−Y{0,M(0)}]=β+αγ
Model assumptions
There are three main assumptions for this quantity to be a valid estimator of the causal mediation effect
- the effect of treatment is linear.
- there is no interaction between mediator M and treatment X.
- the sequential ignorability assumption holds.
Sobel's test
Based on estimators of coefficients ˆα and ˆγ, construct a test statistic S=ˆαˆγ−0se(ˆαˆγ)
The coefficient and variance estimates can be extracted from the output of the regression model.
In large sample, S⋅∼Normal(0,1), but this approximation may be poor in small samples.
Without interaction/accounting for confounders, αγ=τ−β and with OLS we get exactly the same point estimates. The derivation of the variance is then relatively straightforward using the delta method.
Other test statistics
Sobel's test is not the only test. Alternative statistics are discussed in
MacKinnon, D. P., Lockwood, C. M., Hoffman, J. M., West, S. G., & Sheets, V. (2002). A comparison of methods to test mediation and other intervening variable effects. Psychological Methods, 7(1), 83–104. https://doi.org/10.1037/1082-989X.7.1.83
Alternative
An alternative to estimate p-value and the confidence interval is through the nonparametric bootstrap with the percentile method, popularized by Preacher and Hayes (2004)
Nonparametric bootstrap: repeat B times, say B=10 000
- sample n (same as original number of observations) tuples (Yi,Xi,Mi) from the database with replacement to obtain a new sample.
- recalculate estimates ˆα(b)ˆγ(b) for each bootstrap dataset
Bootstrap confidence intervals
Percentile-based method: for a equitailed 1−α interval
Run the nonparametric bootstrap and obtain estimates ˆα(b) and ˆγ(b) from the bth bootstrap sample.
Compute the α/2 and 1−α/2 empirical quantiles of {ˆα(b)ˆγ(b)}Bb=1.
Boostrap two-sided p-value
Compute the sample proportion of bootstrap statistics that are larger/smaller than zero.
- Order bootstrap statistics S(1)≤⋯≤S(B) and let S(0)=−∞, S(M+1)=∞.
- Find M ( 0≤M≤B ) such that S(M)<0≤S(M+1) (if it exists)
- The p-value is
p=2min{M/B,1−M/B}.
Note: many bootstraps! parametric, wild, sieve, block, etc. and many methods (basic, studentized, bias corrected and accelerated) for confidence intervals
Model assumptions
Same assumptions as analysis of variance and linear models
- Linearity of the mean model
- check via residual plots, fitted values ˆy against m and x
- Independent/uncorrelated errors
- no confounding
- Equal variance of errors in each model (homoskedasticity)
- Large samples
Causal assumptions
Conclusions about mediation are valid only when causal assumptions hold.
Assuming that X is randomized, we need
- Lack of interaction between X and M (moderated mediation)
- Causal direction: M→Y
- M must be an antecedent, i.e., must be measured before Y
- Reliability of M (no measurement error)
- No confounding between Y and M
- Effect constant over individuals/levels
Sensitivity analysis
The no-unmeasured confounders assumption should be challenged.
Check the robustness of the conclusions by considering potential correlation between errors, as E(ˆγ)=γ+Cor(εm,εy)√Va(εy)Va(εm)
- We vary ρ=Cor(εm,εy) to assess the sensitivity to confounding.
- The
medsensfunction in the R packagemediationimplements the diagnostic of Imai, Keele and Yamamoto (2010) for the linear mediation model.
Defaults of linear mediation models
- Definitions contingent on model
- (even if causal quantities have a meaning regardless of estimation method)
- Most papers do not consider confounders, or even check for assumptions
- Generalizations to interactions, multiple mediators, etc., requires care.
 Keenan Crane
Extension: moderated mediation
Consider a more complex setting where the effect of the experimental factor X depends on the mediator, a case termed moderated mediator Judd and Kenny (1982).
In this case, the equation for the response variable becomes E(Y∣M=m,X=x,Z=z)=cY+βx+γm+κxm+zω
ACME for moderated mediation
Upon substituting the equations for both inside the definition of average causal mediation effect, we find that the latter equals ACME(x)=(γ+κx){M(1)−M(0)}=α(γ+κx). and thus the value differs depending on experimental regime (treatment or control), due to the presence of the interaction.
Both the average direct and total effects now depend on the theoretical average values of the covariates Z added to the model to control for confounding.
General approach
Imai et al. (2010) suggest using simulation for general models that naturally account for nonlinear effects, different natures of the mediator (binary, categorical, etc.) and the response.
- [1] Modelling. Specify models to each relationship
- a mediator model fM(x,z;θM) that includes X and potential confounders Z
- an outcome model fY(x,m,z;θY) with both treatment indicator X, mediator M and potential confounders Z.
- [2] Draw M realizations of the mediation model for each observation i=1,…,n, giving M(jm)i(1) and M(jm)i(0). Use these resulting to obtain one draw from the outcome model for each of
Y(m)i{x1,M(m)i(x2)},x1,x2∈{0,1}.
General approach
- [3] Plug these quantities in the definitions of ACME(x), ADE(x) and TE, averaging over the nM replications, over both observations i=1,…,n and replications m=1,…,M.
- [4] Estimation uncertainty: Either use nonparametric bootstrap or a large-sample approximation to the distribution of model parameters θM and θY, repeat steps [2]--[3] to get J copies of ACME(x), ADE(x) and TE.
- [5] Use the J replications to compute a 95% percentile interval and return the sample means over J for the average causal effects.
Key references
- Judd and Kenny (1981). Process analysis: Estimating mediation in treatment evaluations, Evaluation Review
- Baron and Kenny (1986), The Moderator-Mediator Variable Distinction in Social Psychological Research: Conceptual, Strategic, and Statistical Considerations, Journal of Personality and Social Psychology.
- Shrout and Bolger(2002), Mediation in experimental and nonexperimental studies: New procedures and recommendations, Psychological Methods.
- Preacher, K. J., and Hayes, A. F. (2004). SPSS and SAS procedures for estimating indirect effects in simple mediation models. Behavior Research Methods, Instruments & Computers.
- Imai, Keele and Tingley (2010), A General Approach to Causal Mediation Analysis, Psychological Methods.
- Imai, Tingley and Yamamoto (2013), Experimental designs for identifying causal mechanisms (with Discussion), Journal of the Royal Statistical Society: Series A.
- Pearl (2014), Interpretation and Identification of Causal Mediation, Psychological Methods.
- Bullock, Green, and Ha (2010), Yes, but what’s the mechanism? (don’t expect an easy answer), Journal of Personality and Social Psychology.
- Simonsohn (2022) Mediation Analysis is Counterintuitively Invalid
- Rohrer, Hünermund, Arslan, and Elson (2022). That’s a lot to process! Pitfalls of popular path models, Advances in Methods and Practices in Psychological Science.