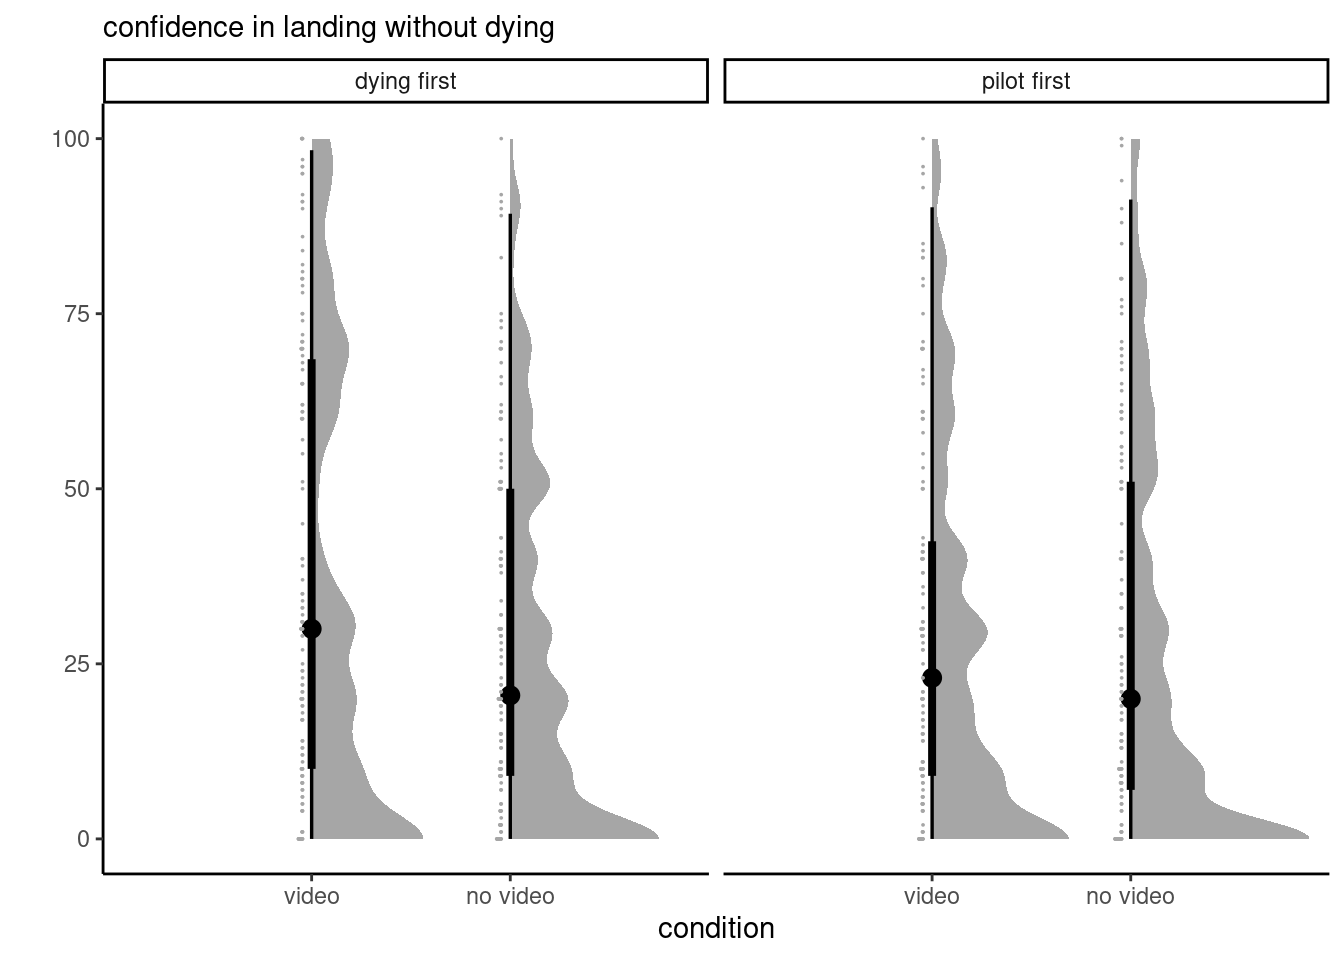
# install.packages(c("ggplot2","ggdist"))
# remotes::install_github("lbelzile/hecedsm")
data(JZBJG22_E2, package = "hecedsm")
library(ggplot2)
library(ggdist)

ggplot(data = JZBJG22_E2,
       mapping = aes(x = condition, group = order, y = conf_dying)) +
  ggdist::stat_halfeye(adjust = .5, width = 1,
                       .width = c(0.5, 0.95)) + # 50% (box) and 95% confidence intervals
  ggdist::stat_dots(side = "left", dotsize = .4, justification = 1.05, binwidth = .1) +
  facet_grid(~order) +
  labs(y = "", subtitle = "confidence in landing without dying") +
theme_classic()Problem set 5
Complete this task individually
Submission information: please submit on ZoneCours
- a PDF report
- your code
Task 1
We consider data from Experiment 2 of Jordan et al. (2022), who measured the confidence of participants on their ability to land successfully a plane if the pilot was incapacitated, after they were exposed to a trivially uninformative 3 minute video of a pilot landing a plane, but filmed in such a way that it was utterly useless. The authors pre-registered a comparison between experimental conditions video vs no video, and found that people watching the video answered higher for the question “How confident are you that you would be able to land the plane without dying”, but there was no discernible effect for “How confident are you that you would be able to successfully land the plane as well as a pilot could”, contrary to expectations. They found that the order in which the questions were asked (order, either pilot first, or dying first) changed the response.
The database in package hecedsm in R is labelled JZBJG22_E2. You can also download the SPSS database via this link.
- A dataset is said to be balanced if there are the same number of people in each experimental condition. Are the data balanced over
conditionandorder? Justify your answer. - Look at Figure Figure 1 and comment on the distribution of the scores along the scale.
- Perform the two-way analysis of variance for both
conf_dyingandconf_pilotand report the null and alternative hypotheses, the test statistic, the - For each response variable
conf_dyingandconf_pilot, perform follow-up tests. Compute simple or main effects (depending on whether the interaction is significant or not), along with 95% confidence intervals for the difference in score forvideoconditions.
Indications and helper code
There is no R script this week, but below are some instructions for fitting the different models.
Graphics
To create a pretty plot in R, try the following:
You must repeat this for the other response variable.
In SPSS, you need to specify manually with GGRAPH the format. This post shows an example of such plots.
Welch ANOVA
Using Levene’s test, we can check whether the variance in each subgroup is the same. In this example, we find that there are significant differences in variance per subgroup, but the effect on
If the variance are unequal, we want to fit a model to observations in subgroup
In R, the Welch ANOVA can be obtained via oneway.test, but there is no possibility of follow-up for marginal means and contrasts. Rather, use the function gls in package nlme as follows.
model <- nlme::gls(
  model = conf_dying ~ condition*order,
  data = JZBJG22_E2,
  weights = nlme::varIdent(form = ~ 1 | condition*order))
# Use condition*order to get a different variance for each subgroup

# ANOVA table for testing the interaction - use type 2
car::Anova(model, type = 2)
To obtain the analysis of variance table in R to an object model representing an ANOVA with unbalanced data, use the car::Anova function. Use type=2 as argument (the default). You can pass model to emmeans as before to compute main/simple effects.
In SPSS, you must first transform the oneway and code directly the contrasts for the interaction, and either the simple effects of condition for each level of order, and the main effect of condition, depending on which is most suitable.
